
Seller's Agent in 2025
Frank Celeste
Gibson Sothebys International Realty
(617) 872-3227
73 in this area
479 Total Sales
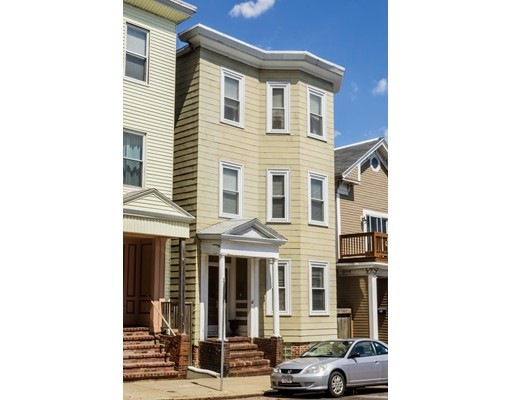

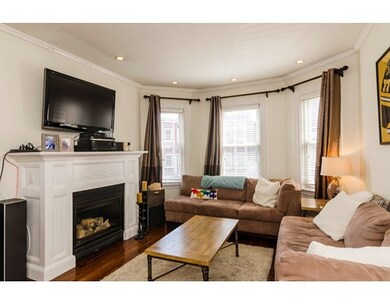

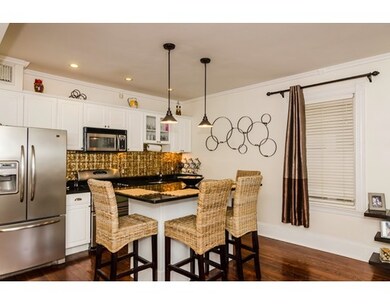
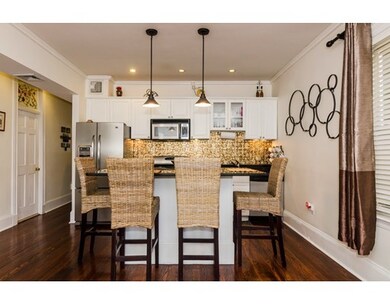
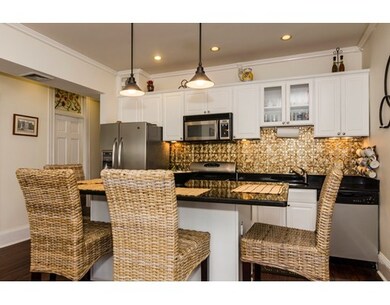
This is the one you have been waiting for!! Sought after Eastside, spacious 3 bedroom, 2 full baths with private deck, yard and built in stone gas grille ready for summer cookouts!! This unique home features open floor plan, gourmet kitchen plus large kitchen island, living room with fireplace, high ceilings and hardwood floors. Private deeded storage plus washer/dryer. One block from the beach!!
Last Agent to Sell the Property
William Raveis R.E. & Home Services Listed on: 04/29/2015
Home Type
Condominium
Est. Annual Taxes
$9,230
Year Built
1905
Lot Details
0
| Date | Type | Sale Price | Title Company |
|---|---|---|---|
| Condominium Deed | $710,000 | -- | |
| Not Resolvable | $600,000 | -- | |
| Not Resolvable | $516,000 | -- | |
| Not Resolvable | $516,000 | -- | |
| Deed | $365,000 | -- | |
| Deed | $347,500 | -- |
| Date | Status | Loan Amount | Loan Type |
|---|---|---|---|
| Open | $532,500 | New Conventional | |
| Previous Owner | $480,000 | New Conventional | |
| Previous Owner | $361,200 | New Conventional | |
| Previous Owner | $283,000 | Purchase Money Mortgage | |
| Previous Owner | $278,000 | Purchase Money Mortgage |
| Date | Event | Price | Change | Sq Ft Price |
|---|---|---|---|---|
| 09/17/2025 09/17/25 | Price Changed | $839,000 | -1.2% | $741 / Sq Ft |
| 06/26/2025 06/26/25 | For Sale | $849,000 | 0.0% | $750 / Sq Ft |
| 12/28/2023 12/28/23 | Rented | $4,000 | -4.8% | -- |
| 12/01/2023 12/01/23 | Under Contract | -- | -- | -- |
| 11/29/2023 11/29/23 | Price Changed | $4,200 | -4.5% | $4 / Sq Ft |
| 11/08/2023 11/08/23 | Price Changed | $4,400 | -2.2% | $4 / Sq Ft |
| 10/26/2023 10/26/23 | For Rent | $4,500 | +1.1% | -- |
| 08/07/2020 08/07/20 | Rented | $4,450 | -1.1% | -- |
| 07/29/2020 07/29/20 | Under Contract | -- | -- | -- |
| 07/24/2020 07/24/20 | Price Changed | $4,500 | -2.2% | $4 / Sq Ft |
| 07/07/2020 07/07/20 | For Rent | $4,600 | +4.5% | -- |
| 06/06/2019 06/06/19 | Rented | $4,400 | 0.0% | -- |
| 05/31/2019 05/31/19 | Under Contract | -- | -- | -- |
| 05/07/2019 05/07/19 | For Rent | $4,400 | 0.0% | -- |
| 04/29/2019 04/29/19 | Sold | $710,000 | -2.7% | $627 / Sq Ft |
| 03/10/2019 03/10/19 | Pending | -- | -- | -- |
| 02/20/2019 02/20/19 | Price Changed | $729,900 | -2.0% | $645 / Sq Ft |
| 02/12/2019 02/12/19 | For Sale | $745,000 | +24.2% | $658 / Sq Ft |
| 08/26/2015 08/26/15 | Sold | $600,000 | 0.0% | $530 / Sq Ft |
| 05/10/2015 05/10/15 | Off Market | $600,000 | -- | -- |
| 04/29/2015 04/29/15 | For Sale | $589,900 | +14.3% | $521 / Sq Ft |
| 08/26/2013 08/26/13 | Sold | $516,000 | +3.4% | $456 / Sq Ft |
| 07/03/2013 07/03/13 | Pending | -- | -- | -- |
| 06/26/2013 06/26/13 | Price Changed | $499,000 | 0.0% | $441 / Sq Ft |
| 06/26/2013 06/26/13 | For Sale | $499,000 | +0.8% | $441 / Sq Ft |
| 06/02/2013 06/02/13 | Pending | -- | -- | -- |
| 05/29/2013 05/29/13 | For Sale | $495,000 | -- | $437 / Sq Ft |
| Year | Tax Paid | Tax Assessment Tax Assessment Total Assessment is a certain percentage of the fair market value that is determined by local assessors to be the total taxable value of land and additions on the property. | Land | Improvement |
|---|---|---|---|---|
| 2025 | $9,230 | $797,100 | $0 | $797,100 |
| 2024 | $8,198 | $752,100 | $0 | $752,100 |
| 2023 | $7,914 | $736,900 | $0 | $736,900 |
| 2022 | $7,707 | $708,400 | $0 | $708,400 |
| 2021 | $7,410 | $694,500 | $0 | $694,500 |
| 2020 | $7,071 | $669,600 | $0 | $669,600 |
| 2019 | $6,597 | $625,900 | $0 | $625,900 |
| 2018 | $6,246 | $596,000 | $0 | $596,000 |
| 2017 | $5,900 | $557,100 | $0 | $557,100 |
| 2016 | $5,782 | $525,600 | $0 | $525,600 |
| 2015 | $5,571 | $460,000 | $0 | $460,000 |
| 2014 | $4,876 | $387,600 | $0 | $387,600 |
Seller's Agent in 2025
Frank Celeste
Gibson Sothebys International Realty
(617) 872-3227
73 in this area
479 Total Sales
Seller Co-Listing Agent in 2025
Jared Kurker
Gibson Sothebys International Realty
(508) 776-9264
2 in this area
14 Total Sales
Seller Co-Listing Agent in 2025
Ash Williams
Gibson Sothebys International Realty
(617) 467-8550
2 in this area
7 Total Sales
B
Buyer's Agent in 2020
Bode Well Team
Compass
(617) 268-9200
2 in this area
12 Total Sales
Seller's Agent in 2019
Amy Carlisle
Compass
(617) 699-0033
8 in this area
23 Total Sales
Buyer's Agent in 2019
Bob Sheridan
Premier Properties
(508) 335-7106
7 Total Sales
Source: MLS Property Information Network (MLS PIN)
MLS Number: 71825847
APN: SBOS-000000-000007-001570-000002
Disclaimer: Certain information contained herein is derived from information provided by parties other than Homes.com. All information provided is deemed reliable, but is not guaranteed to be accurate and should be independently verified.
![]() The property listing data and information, or the Images, set forth herein were provided to MLS Property Information Network, Inc. from third party sources, including sellers, lessors and public records, and were compiled by MLS Property Information Network, Inc. The property listing data and information, and the Images, are for the personal, non-commercial use of consumers having a good faith interest in purchasing or leasing listed properties of the type displayed to them and may not be used for any purpose other than to identify prospective properties which such consumers may have a good faith interest in purchasing or leasing. MLS Property Information Network, Inc. and its subscribers disclaim any and all representations and warranties as to the accuracy of the property listing data and information, or as to the accuracy of any of the Images, set forth herein.
The property listing data and information, or the Images, set forth herein were provided to MLS Property Information Network, Inc. from third party sources, including sellers, lessors and public records, and were compiled by MLS Property Information Network, Inc. The property listing data and information, and the Images, are for the personal, non-commercial use of consumers having a good faith interest in purchasing or leasing listed properties of the type displayed to them and may not be used for any purpose other than to identify prospective properties which such consumers may have a good faith interest in purchasing or leasing. MLS Property Information Network, Inc. and its subscribers disclaim any and all representations and warranties as to the accuracy of the property listing data and information, or as to the accuracy of any of the Images, set forth herein.