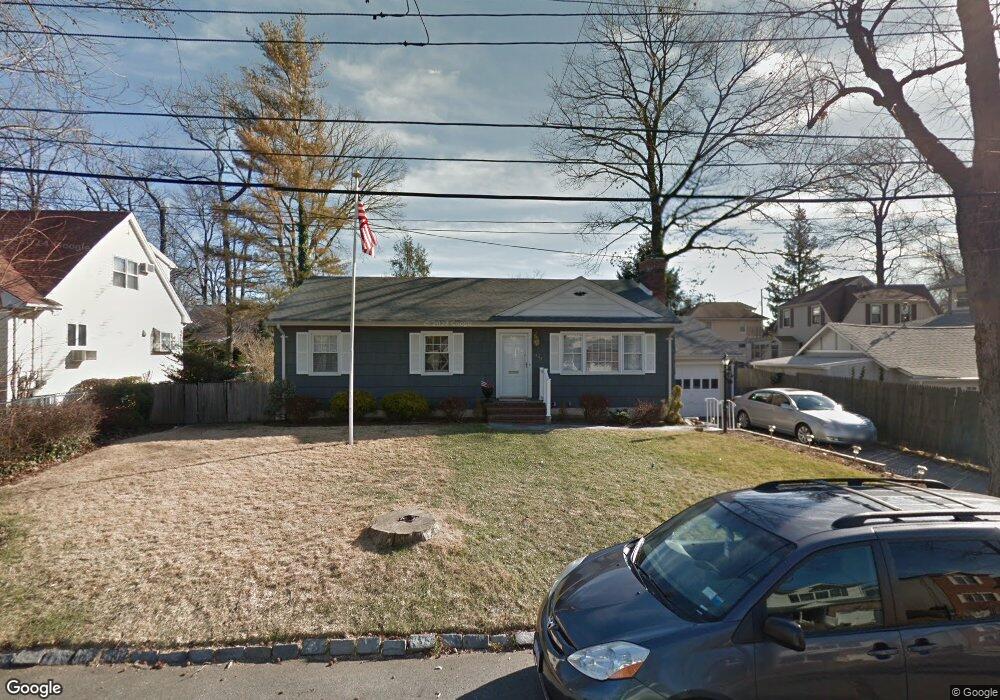
444 Flint St Staten Island, NY 10306
Oakwood NeighborhoodEstimated Value: $645,000 - $876,000
--
Bed
4
Baths
1,088
Sq Ft
$703/Sq Ft
Est. Value
About This Home
This home is located at 444 Flint St, Staten Island, NY 10306 and is currently estimated at $764,331, approximately $702 per square foot. 444 Flint St is a home located in Richmond County with nearby schools including P.S. 50 Frank Hankinson School, Myra S. Barnes Intermediate School 24, and New Dorp High School.
Ownership History
Date
Name
Owned For
Owner Type
Purchase Details
Closed on
Aug 30, 2018
Sold by
Viscardi Antyony S and Viscardi Lena Viscardi
Bought by
Viscardi Janemarie and Viscardi Roseann G
Current Estimated Value
Purchase Details
Closed on
Oct 23, 2009
Sold by
Taylor Douglas A and Taylor Patricia M
Bought by
Viscardi Anthony S and Viscardi Lena
Purchase Details
Closed on
Jun 4, 2007
Sold by
Taylor Patricia
Bought by
Taylor Douglas A and Taylor Patricia M
Create a Home Valuation Report for This Property
The Home Valuation Report is an in-depth analysis detailing your home's value as well as a comparison with similar homes in the area
Home Values in the Area
Average Home Value in this Area
Purchase History
| Date | Buyer | Sale Price | Title Company |
|---|---|---|---|
| Viscardi Janemarie | -- | None Available | |
| Viscardi Anthony S | $520,000 | Old Republic National Title | |
| Taylor Douglas A | -- | None Available |
Source: Public Records
Tax History Compared to Growth
Tax History
| Year | Tax Paid | Tax Assessment Tax Assessment Total Assessment is a certain percentage of the fair market value that is determined by local assessors to be the total taxable value of land and additions on the property. | Land | Improvement |
|---|---|---|---|---|
| 2025 | $6,907 | $49,860 | $9,766 | $40,094 |
| 2024 | $6,907 | $42,360 | $11,495 | $30,865 |
| 2023 | $6,931 | $34,127 | $9,739 | $24,388 |
| 2022 | $5,539 | $43,500 | $14,160 | $29,340 |
| 2021 | $5,483 | $39,780 | $14,160 | $25,620 |
| 2020 | $5,160 | $37,080 | $14,160 | $22,920 |
| 2019 | $6,392 | $39,960 | $14,160 | $25,800 |
| 2018 | $4,913 | $28,439 | $9,685 | $18,754 |
| 2017 | $4,827 | $26,830 | $12,513 | $14,317 |
| 2016 | $4,429 | $25,312 | $13,187 | $12,125 |
| 2015 | $3,995 | $23,880 | $11,820 | $12,060 |
| 2014 | $3,995 | $23,880 | $11,820 | $12,060 |
Source: Public Records
Map
Nearby Homes