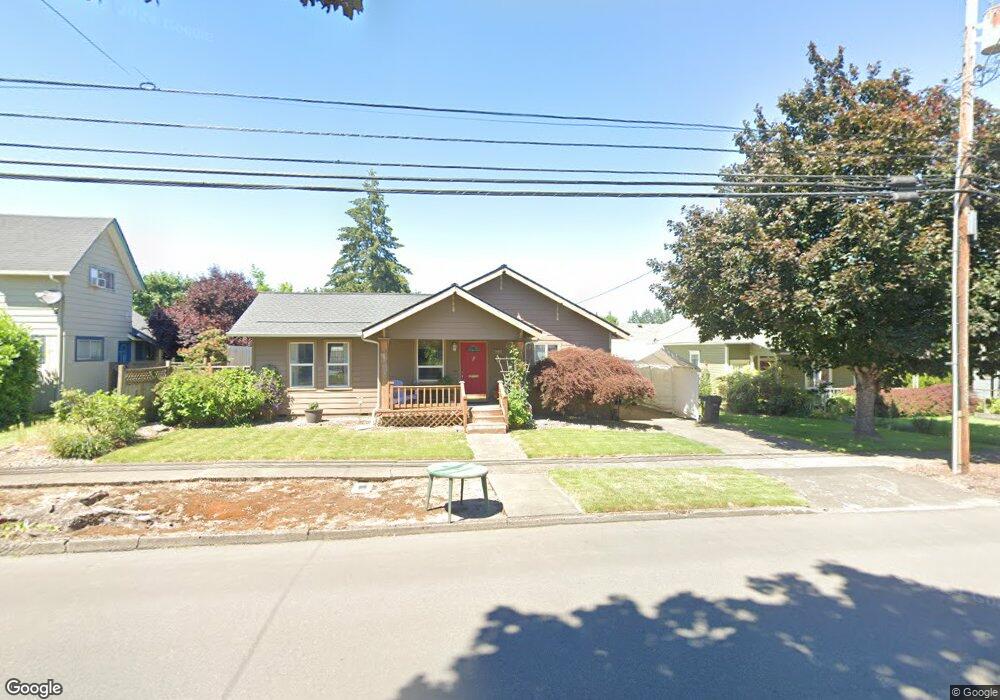
444 Jackson St E Monmouth, OR 97361
Estimated Value: $360,000 - $428,000
2
Beds
1
Bath
1,136
Sq Ft
$338/Sq Ft
Est. Value
About This Home
This home is located at 444 Jackson St E, Monmouth, OR 97361 and is currently estimated at $383,523, approximately $337 per square foot. 444 Jackson St E is a home located in Polk County with nearby schools including Monmouth Elementary School, Talmadge Middle School, and Central High School.
Ownership History
Date
Name
Owned For
Owner Type
Purchase Details
Closed on
Oct 22, 2008
Sold by
Hagar Victoria Lee and Loos Victoria Lee
Bought by
Hagar Shawn M and Hagar Victoria Lee
Current Estimated Value
Purchase Details
Closed on
Mar 2, 2006
Sold by
Loos Victoria Lee
Bought by
Vannice Victoria Lee
Home Financials for this Owner
Home Financials are based on the most recent Mortgage that was taken out on this home.
Original Mortgage
$3,500
Interest Rate
6.08%
Mortgage Type
Unknown
Purchase Details
Closed on
Mar 31, 2004
Sold by
Loos Damon Paul and Loos Vikki Lee
Bought by
Loos Victoria Lee
Home Financials for this Owner
Home Financials are based on the most recent Mortgage that was taken out on this home.
Original Mortgage
$104,800
Interest Rate
5.57%
Mortgage Type
New Conventional
Create a Home Valuation Report for This Property
The Home Valuation Report is an in-depth analysis detailing your home's value as well as a comparison with similar homes in the area
Home Values in the Area
Average Home Value in this Area
Purchase History
| Date | Buyer | Sale Price | Title Company |
|---|---|---|---|
| Hagar Shawn M | -- | None Available | |
| Vannice Victoria Lee | -- | None Available | |
| Loos Victoria Lee | -- | Fidelity National Title |
Source: Public Records
Mortgage History
| Date | Status | Borrower | Loan Amount |
|---|---|---|---|
| Closed | Vannice Victoria Lee | $3,500 | |
| Previous Owner | Loos Victoria Lee | $104,800 |
Source: Public Records
Tax History
| Year | Tax Paid | Tax Assessment Tax Assessment Total Assessment is a certain percentage of the fair market value that is determined by local assessors to be the total taxable value of land and additions on the property. | Land | Improvement |
|---|---|---|---|---|
| 2025 | $2,733 | $165,760 | $49,160 | $116,600 |
| 2024 | $2,733 | $160,940 | $47,730 | $113,210 |
| 2023 | $2,847 | $156,260 | $46,340 | $109,920 |
| 2022 | $2,562 | $151,710 | $44,990 | $106,720 |
| 2021 | $2,533 | $147,300 | $43,680 | $103,620 |
| 2020 | $2,432 | $143,010 | $42,410 | $100,600 |
| 2019 | $2,443 | $143,660 | $41,180 | $102,480 |
| 2018 | $2,359 | $139,480 | $39,980 | $99,500 |
| 2017 | $2,347 | $135,420 | $38,820 | $96,600 |
| 2016 | $2,397 | $131,480 | $37,690 | $93,790 |
Source: Public Records
Map
Nearby Homes
- 145 Ecols St N
- 191 Catron St S
- 790 Clay St E
- 441 Craven St N
- 952 Main St E
- 435 Gentle Ave E
- 751 Catron St N
- 228 Clay St W
- 555 Sacre Ln N
- 784 Dalke St E
- 505 Broad St S
- 297 Main St W
- 615 Sacre Ln N
- 545 Warren St S
- 545 Warren St S Unit 12
- 412 Monmouth Ave S
- 738 E Fen Way
- 1328 Alberta Ave E
- 1329 Price Ln E
- 932 Olive Way E
- 460 Jackson St E
- 414 Jackson St E
- 247 Ecols St N
- 208 Catron St N
- 253 Ecols St N
- 230 Catron St N
- 156 Catron (Next To) St N
- next to 156 Jackson St N
- 421 Jackson St E
- 461 Jackson St E
- 156 Catron (- 196) St
- 196 Catron St
- 196 Catron St N
- 156 Catron St N
- 250 Catron St N
- 212 Ecols St N
- 236 Ecols St N
- 156 Catron (-196) St N
- 156 Catron St N
- 461 Powell St E
Your Personal Tour Guide
Ask me questions while you tour the home.