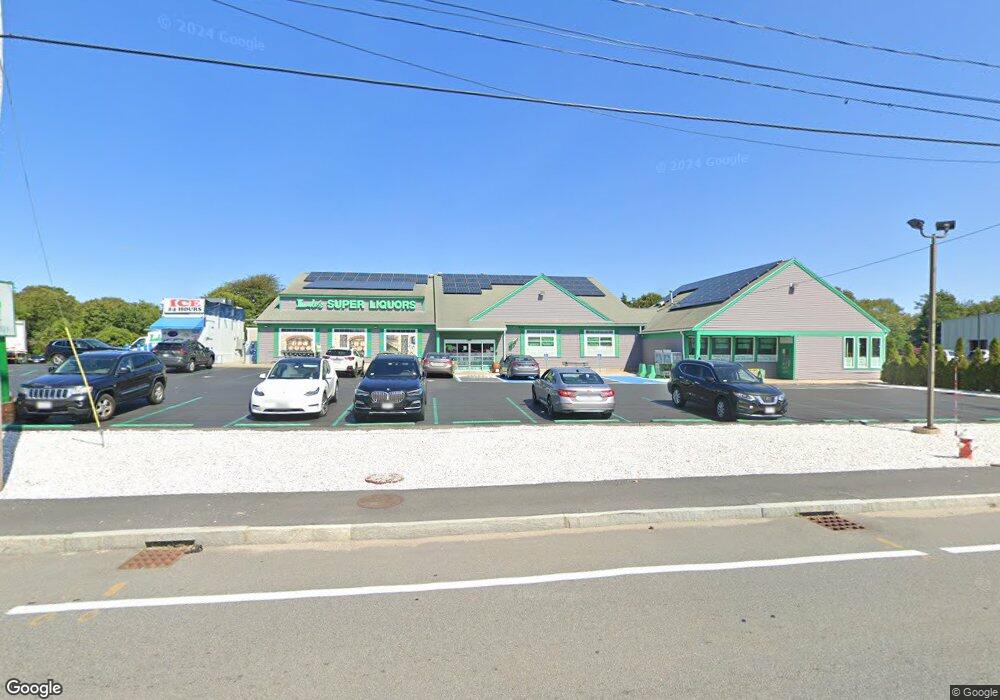
444 Main St Dennis Port, MA 02639
Dennis Port NeighborhoodEstimated Value: $1,624,939
--
Bed
--
Bath
8,282
Sq Ft
$196/Sq Ft
Est. Value
About This Home
This home is located at 444 Main St, Dennis Port, MA 02639 and is currently estimated at $1,624,939, approximately $196 per square foot. 444 Main St is a home located in Barnstable County with nearby schools including Dennis-Yarmouth Regional High School.
Ownership History
Date
Name
Owned For
Owner Type
Purchase Details
Closed on
Oct 24, 2008
Sold by
Shaul & Meir Levy Ptnshp
Bought by
444 Main Street Rt
Current Estimated Value
Home Financials for this Owner
Home Financials are based on the most recent Mortgage that was taken out on this home.
Original Mortgage
$575,000
Interest Rate
5.94%
Mortgage Type
Commercial
Purchase Details
Closed on
Jan 3, 1994
Sold by
Norfolk Holdings Corp
Bought by
Potlatch Rt
Home Financials for this Owner
Home Financials are based on the most recent Mortgage that was taken out on this home.
Original Mortgage
$381,500
Interest Rate
7%
Mortgage Type
Commercial
Purchase Details
Closed on
Dec 13, 1989
Sold by
Fifty-Four Rt
Bought by
Fredrick Rt
Home Financials for this Owner
Home Financials are based on the most recent Mortgage that was taken out on this home.
Original Mortgage
$975,000
Interest Rate
9.73%
Mortgage Type
Commercial
Create a Home Valuation Report for This Property
The Home Valuation Report is an in-depth analysis detailing your home's value as well as a comparison with similar homes in the area
Home Values in the Area
Average Home Value in this Area
Purchase History
| Date | Buyer | Sale Price | Title Company |
|---|---|---|---|
| 444 Main Street Rt | $719,000 | -- | |
| Potlatch Rt | $545,000 | -- | |
| Fredrick Rt | $975,000 | -- |
Source: Public Records
Mortgage History
| Date | Status | Borrower | Loan Amount |
|---|---|---|---|
| Open | Fredrick Rt | $864,000 | |
| Closed | 444 Main Street Rt | $575,000 | |
| Previous Owner | Fredrick Rt | $200,000 | |
| Previous Owner | Potlatch Rt | $381,500 | |
| Previous Owner | Fredrick Rt | $975,000 |
Source: Public Records
Tax History Compared to Growth
Tax History
| Year | Tax Paid | Tax Assessment Tax Assessment Total Assessment is a certain percentage of the fair market value that is determined by local assessors to be the total taxable value of land and additions on the property. | Land | Improvement |
|---|---|---|---|---|
| 2025 | $5,145 | $1,188,200 | $307,100 | $881,100 |
| 2024 | $4,996 | $1,138,000 | $296,000 | $842,000 |
| 2023 | $5,060 | $1,083,500 | $281,900 | $801,600 |
| 2022 | $5,746 | $1,026,000 | $265,900 | $760,100 |
| 2021 | $5,968 | $989,700 | $260,700 | $729,000 |
| 2020 | $5,914 | $969,500 | $257,600 | $711,900 |
| 2019 | $5,976 | $968,600 | $234,200 | $734,400 |
| 2018 | $6,152 | $970,300 | $234,200 | $736,100 |
| 2017 | $5,967 | $970,300 | $234,200 | $736,100 |
| 2016 | $6,537 | $1,001,000 | $210,800 | $790,200 |
| 2015 | $5,405 | $844,600 | $210,800 | $633,800 |
| 2014 | $5,363 | $844,600 | $210,800 | $633,800 |
Source: Public Records
Map
Nearby Homes
- 10 Candlewood Ln Unit 2-1
- 12 Candlewood Ln Unit 2-9
- 9 Country Ln
- 12 Cross St
- 268 Main St
- 72 Bassett Ln
- 47 Telegraph Rd Unit 1
- 159 Center St Unit 22
- 78 Upper County Rd Unit A&B
- 78 Upper County Rd
- 22 Wixon Rd
- 26 Manning Rd
- 24 Indian Trail
- 73 Division St
- 141 Division St
- 141 Division St
- 125 Main St Unit 3
- 4 Coffey Ln
- 31 Easy St
- 102 Sea St
- 435 Massachusetts 28
- 435 Massachusetts 28 Unit 1
- 466-E Main St
- 466-D Main St
- 422 Massachusetts 28
- 438 Main St
- 438 Main St Unit 1-9
- 453 Main St
- 441 Main St
- 461 Main St
- 471 Main St
- 476 Main St
- 432 Main St
- 432 Massachusetts 28
- 435 Main St
- 435 Main St
- 435 Main St Unit A
- 435 Main St Unit B
- 420 Main St
- 477 Main St