444 Main St Marshfield, MA 02050
Estimated Value: $869,000 - $949,000
3
Beds
3
Baths
2,022
Sq Ft
$449/Sq Ft
Est. Value
About This Home
This home is located at 444 Main St, Marshfield, MA 02050 and is currently estimated at $907,517, approximately $448 per square foot. 444 Main St is a home located in Plymouth County with nearby schools including South River, Furnace Brook Middle School, and Marshfield High School.
Ownership History
Date
Name
Owned For
Owner Type
Purchase Details
Closed on
Jan 20, 2010
Sold by
Smith Harold E and Smith Evelyn L
Bought by
Joseph Eric
Current Estimated Value
Home Financials for this Owner
Home Financials are based on the most recent Mortgage that was taken out on this home.
Original Mortgage
$329,600
Outstanding Balance
$214,638
Interest Rate
4.79%
Mortgage Type
Purchase Money Mortgage
Estimated Equity
$692,879
Purchase Details
Closed on
Jun 10, 2008
Sold by
Rivers David L and Rivers Marlene P
Bought by
Smith Harold E and Smith Evelyn L
Home Financials for this Owner
Home Financials are based on the most recent Mortgage that was taken out on this home.
Original Mortgage
$348,000
Interest Rate
6.11%
Mortgage Type
Purchase Money Mortgage
Create a Home Valuation Report for This Property
The Home Valuation Report is an in-depth analysis detailing your home's value as well as a comparison with similar homes in the area
Home Values in the Area
Average Home Value in this Area
Purchase History
| Date | Buyer | Sale Price | Title Company |
|---|---|---|---|
| Joseph Eric | $412,000 | -- | |
| Smith Harold E | $435,000 | -- |
Source: Public Records
Mortgage History
| Date | Status | Borrower | Loan Amount |
|---|---|---|---|
| Open | Joseph Eric | $329,600 | |
| Previous Owner | Smith Harold E | $348,000 |
Source: Public Records
Tax History
| Year | Tax Paid | Tax Assessment Tax Assessment Total Assessment is a certain percentage of the fair market value that is determined by local assessors to be the total taxable value of land and additions on the property. | Land | Improvement |
|---|---|---|---|---|
| 2025 | $7,970 | $805,000 | $324,100 | $480,900 |
| 2024 | $7,736 | $744,600 | $308,800 | $435,800 |
| 2023 | $7,200 | $663,400 | $286,700 | $376,700 |
| 2022 | $7,200 | $556,000 | $231,900 | $324,100 |
| 2021 | $6,879 | $521,500 | $229,700 | $291,800 |
| 2020 | $6,582 | $493,800 | $210,100 | $283,700 |
| 2019 | $6,390 | $477,600 | $210,100 | $267,500 |
| 2018 | $6,313 | $472,200 | $210,100 | $262,100 |
| 2017 | $6,075 | $442,800 | $199,200 | $243,600 |
| 2016 | $5,766 | $415,400 | $188,300 | $227,100 |
| 2015 | $5,448 | $409,900 | $188,300 | $221,600 |
| 2014 | $5,161 | $388,300 | $173,100 | $215,200 |
Source: Public Records
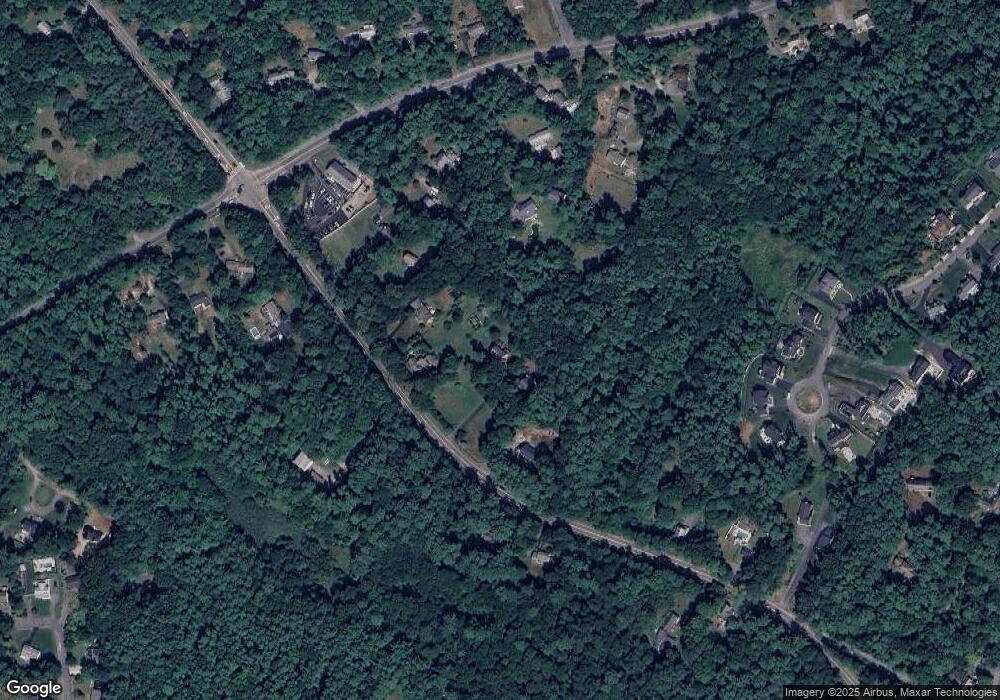
Map
Nearby Homes
- 235 Main St
- 167 Planting Field Rd
- 2 Proprietors Dr Unit 25
- 2 Proprietors Dr Unit 26
- 2 Proprietors Dr Unit 27
- 3 Red Pony Path Unit 3
- 14 Red Pony Path
- 889 Old Main Street Extension
- 39 High Beacon Way
- 92 Salt Meadow Waye
- 848 Plain St Unit 41
- 848 Plain St Unit 23
- 16 Schooner Way
- 1155 Main St
- 451 School St Unit 5-2
- 6 Maple Ln
- 566 Holly Rd
- 10 Royal Dane Dr Unit 85
- 152 Acorn St
- 5 Royal Dane Dr Unit 45
Your Personal Tour Guide
Ask me questions while you tour the home.