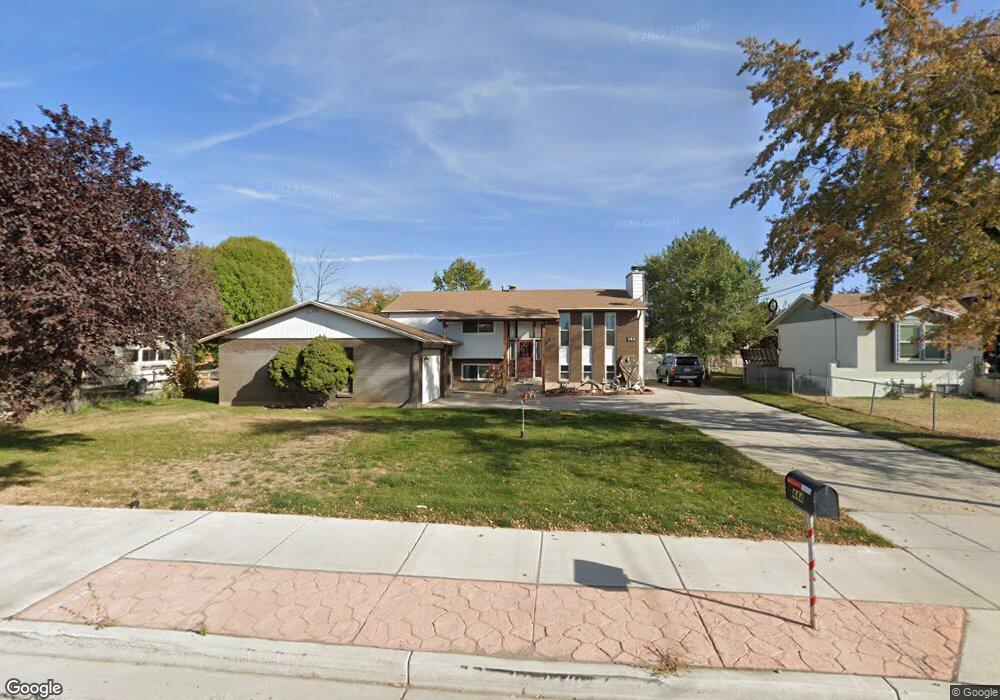
444 N 2000 W Clearfield, UT 84015
Estimated Value: $478,000 - $586,000
7
Beds
3
Baths
2,780
Sq Ft
$187/Sq Ft
Est. Value
About This Home
This home is located at 444 N 2000 W, Clearfield, UT 84015 and is currently estimated at $520,555, approximately $187 per square foot. 444 N 2000 W is a home located in Davis County with nearby schools including Lakeside School, West Point Junior High School, and Syracuse High School.
Ownership History
Date
Name
Owned For
Owner Type
Purchase Details
Closed on
Jul 28, 2010
Sold by
Womack George A and Womack Varalyn R
Bought by
Rios Salvador T and Rios Laura C
Current Estimated Value
Home Financials for this Owner
Home Financials are based on the most recent Mortgage that was taken out on this home.
Original Mortgage
$202,276
Outstanding Balance
$132,928
Interest Rate
4.5%
Mortgage Type
FHA
Estimated Equity
$387,627
Purchase Details
Closed on
Nov 27, 2001
Sold by
Roberts Billy K and Roberts Connie H
Bought by
Womack George A and Womack Varalyn R
Home Financials for this Owner
Home Financials are based on the most recent Mortgage that was taken out on this home.
Original Mortgage
$124,000
Interest Rate
6.63%
Purchase Details
Closed on
May 11, 2000
Sold by
Roberts Billy K and Roberts Connie H
Bought by
Roberts Billy K and Roberts Connie H
Create a Home Valuation Report for This Property
The Home Valuation Report is an in-depth analysis detailing your home's value as well as a comparison with similar homes in the area
Home Values in the Area
Average Home Value in this Area
Purchase History
| Date | Buyer | Sale Price | Title Company |
|---|---|---|---|
| Rios Salvador T | -- | Hickman Land Title Co | |
| Womack George A | -- | Associated Title Company | |
| Roberts Billy K | -- | -- |
Source: Public Records
Mortgage History
| Date | Status | Borrower | Loan Amount |
|---|---|---|---|
| Open | Rios Salvador T | $202,276 | |
| Previous Owner | Womack George A | $124,000 |
Source: Public Records
Tax History
| Year | Tax Paid | Tax Assessment Tax Assessment Total Assessment is a certain percentage of the fair market value that is determined by local assessors to be the total taxable value of land and additions on the property. | Land | Improvement |
|---|---|---|---|---|
| 2025 | $2,782 | $260,700 | $131,055 | $129,645 |
| 2024 | $2,670 | $251,349 | $117,888 | $133,461 |
| 2023 | $2,454 | $425,000 | $153,094 | $271,906 |
| 2022 | $2,640 | $250,250 | $81,403 | $168,847 |
| 2021 | $2,447 | $347,000 | $120,442 | $226,558 |
| 2020 | $2,123 | $297,000 | $102,386 | $194,614 |
| 2019 | $2,138 | $295,000 | $98,974 | $196,026 |
| 2018 | $1,956 | $266,000 | $96,360 | $169,640 |
| 2016 | $1,597 | $114,291 | $37,398 | $76,893 |
| 2015 | $1,592 | $107,965 | $37,398 | $70,567 |
| 2014 | $1,774 | $121,970 | $37,398 | $84,572 |
| 2013 | -- | $116,761 | $32,189 | $84,572 |
Source: Public Records
Map
Nearby Homes
Your Personal Tour Guide
Ask me questions while you tour the home.