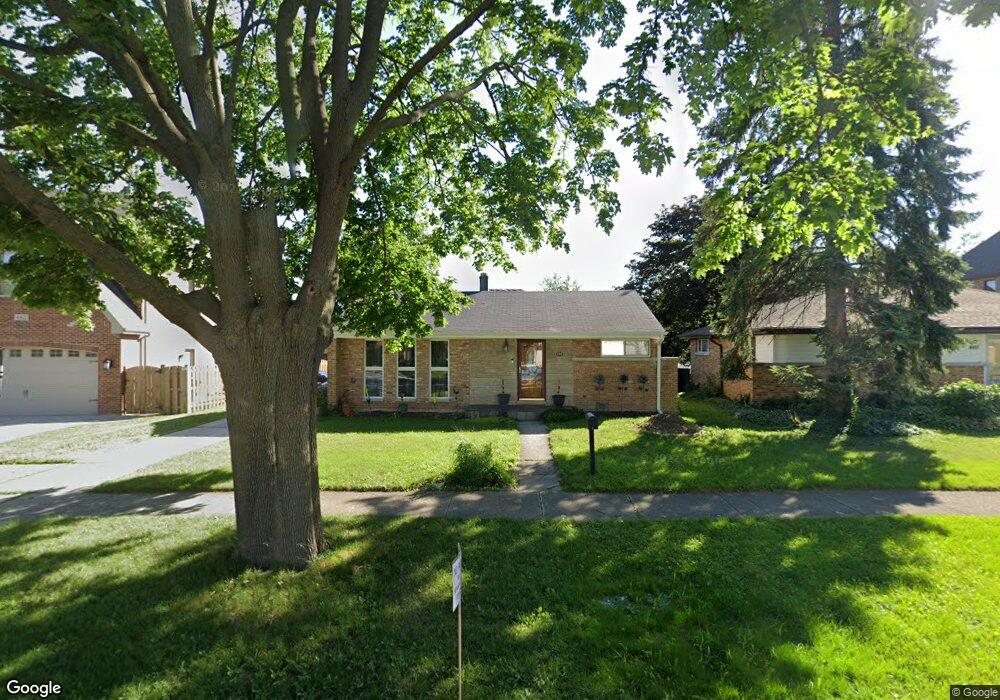
444 N Emery Ln Elmhurst, IL 60126
Estimated Value: $380,000 - $505,000
--
Bed
--
Bath
1,007
Sq Ft
$455/Sq Ft
Est. Value
About This Home
This home is located at 444 N Emery Ln, Elmhurst, IL 60126 and is currently estimated at $457,836, approximately $454 per square foot. 444 N Emery Ln is a home located in DuPage County with nearby schools including Emerson Elementary School, Churchville Middle School, and York Community High School.
Ownership History
Date
Name
Owned For
Owner Type
Purchase Details
Closed on
Jun 25, 2002
Sold by
Vidovic Predrag and Vidovic Rajna
Bought by
Eiseman Raul J
Current Estimated Value
Home Financials for this Owner
Home Financials are based on the most recent Mortgage that was taken out on this home.
Original Mortgage
$143,250
Outstanding Balance
$60,997
Interest Rate
6.91%
Estimated Equity
$396,839
Purchase Details
Closed on
Nov 26, 1999
Sold by
Piotrowski George
Bought by
Vidovic Predrag and Vidovic Rajna
Home Financials for this Owner
Home Financials are based on the most recent Mortgage that was taken out on this home.
Original Mortgage
$121,575
Interest Rate
7.76%
Mortgage Type
FHA
Purchase Details
Closed on
Aug 25, 1993
Sold by
Mejia Luis and Mejia Janina
Bought by
Piotrowski George
Home Financials for this Owner
Home Financials are based on the most recent Mortgage that was taken out on this home.
Original Mortgage
$98,000
Interest Rate
7.32%
Create a Home Valuation Report for This Property
The Home Valuation Report is an in-depth analysis detailing your home's value as well as a comparison with similar homes in the area
Home Values in the Area
Average Home Value in this Area
Purchase History
| Date | Buyer | Sale Price | Title Company |
|---|---|---|---|
| Eiseman Raul J | $191,000 | -- | |
| Vidovic Predrag | $131,000 | -- | |
| Piotrowski George | -- | Lenders Title Guaranty |
Source: Public Records
Mortgage History
| Date | Status | Borrower | Loan Amount |
|---|---|---|---|
| Open | Eiseman Raul J | $143,250 | |
| Previous Owner | Vidovic Predrag | $121,575 | |
| Previous Owner | Piotrowski George | $98,000 |
Source: Public Records
Tax History Compared to Growth
Tax History
| Year | Tax Paid | Tax Assessment Tax Assessment Total Assessment is a certain percentage of the fair market value that is determined by local assessors to be the total taxable value of land and additions on the property. | Land | Improvement |
|---|---|---|---|---|
| 2024 | $6,793 | $118,919 | $70,816 | $48,103 |
| 2023 | $6,253 | $109,320 | $65,100 | $44,220 |
| 2022 | $6,032 | $104,470 | $62,300 | $42,170 |
| 2021 | $5,769 | $100,060 | $59,670 | $40,390 |
| 2020 | $5,423 | $95,840 | $57,150 | $38,690 |
| 2019 | $5,364 | $92,150 | $54,950 | $37,200 |
| 2018 | $5,019 | $86,130 | $52,340 | $33,790 |
| 2017 | $4,915 | $82,310 | $50,020 | $32,290 |
| 2016 | $4,698 | $75,990 | $46,180 | $29,810 |
| 2015 | $4,595 | $70,200 | $42,660 | $27,540 |
| 2014 | $4,043 | $57,930 | $35,200 | $22,730 |
| 2013 | $4,030 | $59,110 | $35,920 | $23,190 |
Source: Public Records
Map
Nearby Homes
- 442 N Oak St
- 412 N Ridgeland Ave
- 468 N Highland Ave
- 322 N Highland Ave
- 456 N Elm Ave
- 407 W North Ave
- 251 W Armitage Ave
- 284 N Highland Ave
- 285 N Ridgeland Ave
- 314 N Elm Ave
- 311 N Shady Ln
- 196 N Walnut St
- 193 N Elm Ave
- 262 N Addison Ave
- 260 N Addison Ave
- 258 N Addison Ave
- 254 N Addison Ave
- 656 W Comstock Ave
- 120 N Walnut St
- 655 W Comstock Ave