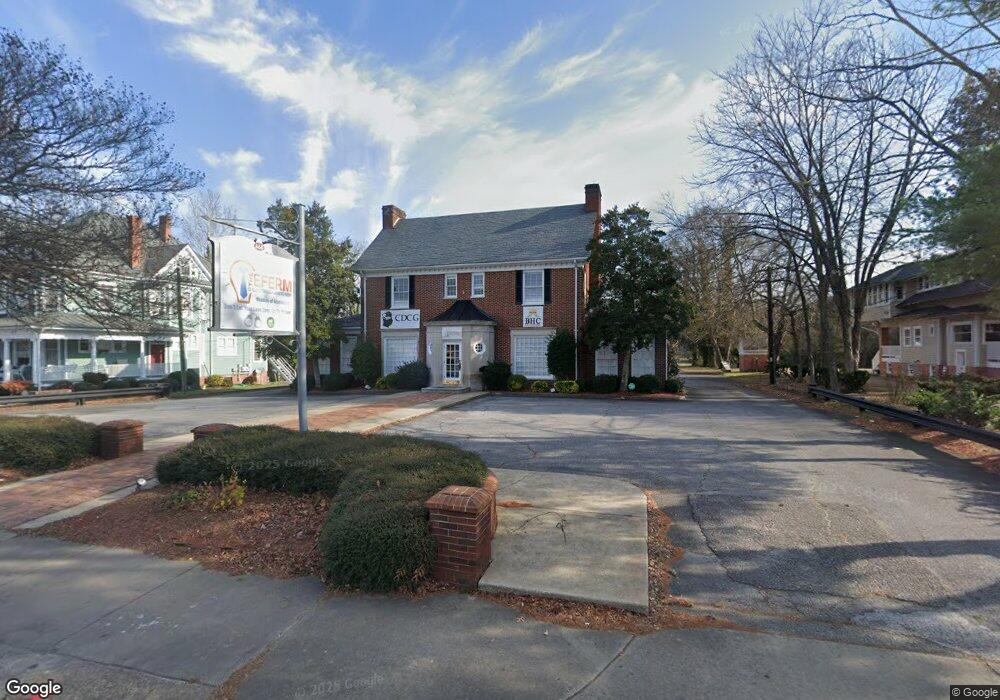
444 N Main St Suffolk, VA 23434
Downtown Suffolk NeighborhoodEstimated Value: $391,126
--
Bed
--
Bath
2,918
Sq Ft
$134/Sq Ft
Est. Value
About This Home
This home is located at 444 N Main St, Suffolk, VA 23434 and is currently estimated at $391,126, approximately $134 per square foot. 444 N Main St is a home located in Suffolk City with nearby schools including Elephant's Fork Elementary School, King's Fork Middle School, and King's Fork High School.
Ownership History
Date
Name
Owned For
Owner Type
Purchase Details
Closed on
Nov 3, 2022
Sold by
Korte Kyle D
Bought by
J & S Future Investments Llc
Current Estimated Value
Home Financials for this Owner
Home Financials are based on the most recent Mortgage that was taken out on this home.
Original Mortgage
$273,000
Outstanding Balance
$264,519
Interest Rate
6.94%
Mortgage Type
New Conventional
Estimated Equity
$126,607
Purchase Details
Closed on
Dec 2, 2020
Sold by
Nansemond Wharf Properties Llc
Bought by
J & S Future Investments Llc
Home Financials for this Owner
Home Financials are based on the most recent Mortgage that was taken out on this home.
Original Mortgage
$273,000
Interest Rate
2.8%
Mortgage Type
Commercial
Create a Home Valuation Report for This Property
The Home Valuation Report is an in-depth analysis detailing your home's value as well as a comparison with similar homes in the area
Home Values in the Area
Average Home Value in this Area
Purchase History
| Date | Buyer | Sale Price | Title Company |
|---|---|---|---|
| J & S Future Investments Llc | $375,000 | -- | |
| J & S Future Investments Llc | $289,100 | Attorney |
Source: Public Records
Mortgage History
| Date | Status | Borrower | Loan Amount |
|---|---|---|---|
| Open | J & S Future Investments Llc | $273,000 | |
| Previous Owner | J & S Future Investments Llc | $273,000 |
Source: Public Records
Tax History Compared to Growth
Tax History
| Year | Tax Paid | Tax Assessment Tax Assessment Total Assessment is a certain percentage of the fair market value that is determined by local assessors to be the total taxable value of land and additions on the property. | Land | Improvement |
|---|---|---|---|---|
| 2024 | $4,169 | $305,100 | $114,200 | $190,900 |
| 2023 | $4,485 | $289,100 | $114,200 | $174,900 |
| 2022 | $3,455 | $289,100 | $114,200 | $174,900 |
| 2021 | $3,336 | $274,600 | $114,200 | $160,400 |
| 2020 | $3,513 | $289,100 | $114,200 | $174,900 |
| 2019 | $3,513 | $289,100 | $114,200 | $174,900 |
| 2018 | $4,481 | $285,600 | $125,400 | $160,200 |
| 2017 | $5,132 | $436,800 | $276,600 | $160,200 |
| 2016 | $5,132 | $436,800 | $276,600 | $160,200 |
| 2015 | $2,495 | $436,800 | $276,600 | $160,200 |
| 2014 | $2,495 | $436,800 | $276,600 | $160,200 |
Source: Public Records
Map
Nearby Homes
- 127 Church St
- 315 W Constance Rd Unit 320
- 307 Hill St
- 305 Hill St
- 104 E Pinner St
- 222 Clay St
- 223 Clay St
- 237 Pinner St
- 307 Central Ave
- 220 North St
- 201 Constance Woods Dr
- 222 Pinner St
- 403 E Constance Rd
- 413 Henry St
- 122 River Point Dr
- 416 N Broad St
- 410 E Constance Rd
- 128 Brewer Ave
- 312 Bank St
- 413 Elizabeth St