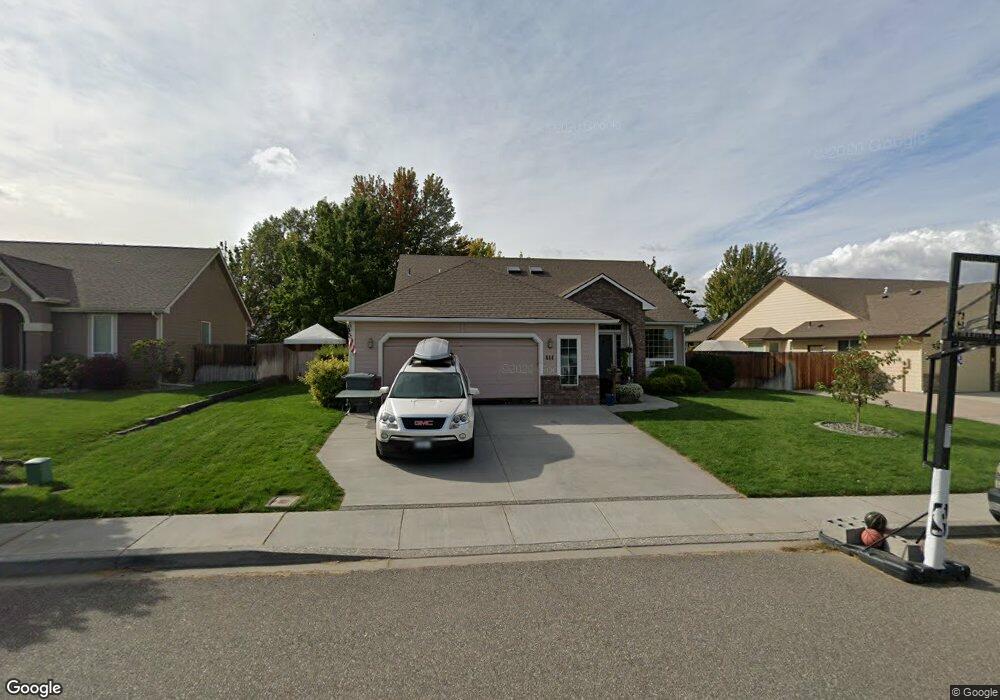
444 Palm Dr Unit Master on Main, 4 Be Richland, WA 99352
Estimated Value: $522,006 - $588,000
3
Beds
3
Baths
2,548
Sq Ft
$212/Sq Ft
Est. Value
About This Home
This home is located at 444 Palm Dr Unit Master on Main, 4 Be, Richland, WA 99352 and is currently estimated at $541,002, approximately $212 per square foot. 444 Palm Dr Unit Master on Main, 4 Be is a home located in Benton County with nearby schools including Orchard Elementary School, Enterprise Middle School, and Richland High School.
Ownership History
Date
Name
Owned For
Owner Type
Purchase Details
Closed on
May 2, 2016
Sold by
Johnson Matthew F and Johnson Sheri L
Bought by
Ashbeck Caleb and Pesicka Christina
Current Estimated Value
Home Financials for this Owner
Home Financials are based on the most recent Mortgage that was taken out on this home.
Original Mortgage
$275,793
Outstanding Balance
$220,192
Interest Rate
3.75%
Mortgage Type
FHA
Estimated Equity
$320,810
Purchase Details
Closed on
Jun 6, 2006
Sold by
Jarman Kenneth D and Jarman Kristin Hoyer
Bought by
Johnson Matthew F and Johnson Sheri L
Home Financials for this Owner
Home Financials are based on the most recent Mortgage that was taken out on this home.
Original Mortgage
$184,000
Interest Rate
6.55%
Mortgage Type
Fannie Mae Freddie Mac
Create a Home Valuation Report for This Property
The Home Valuation Report is an in-depth analysis detailing your home's value as well as a comparison with similar homes in the area
Home Values in the Area
Average Home Value in this Area
Purchase History
| Date | Buyer | Sale Price | Title Company |
|---|---|---|---|
| Ashbeck Caleb | $281,900 | Benton Franklin Title Co | |
| Johnson Matthew F | $230,000 | Chicago Title |
Source: Public Records
Mortgage History
| Date | Status | Borrower | Loan Amount |
|---|---|---|---|
| Open | Ashbeck Caleb | $275,793 | |
| Previous Owner | Johnson Matthew F | $184,000 |
Source: Public Records
Tax History Compared to Growth
Tax History
| Year | Tax Paid | Tax Assessment Tax Assessment Total Assessment is a certain percentage of the fair market value that is determined by local assessors to be the total taxable value of land and additions on the property. | Land | Improvement |
|---|---|---|---|---|
| 2024 | $3,440 | $384,060 | $85,000 | $299,060 |
| 2023 | $3,440 | $366,970 | $85,000 | $281,970 |
| 2022 | $3,125 | $307,160 | $85,000 | $222,160 |
| 2021 | $3,060 | $281,520 | $85,000 | $196,520 |
| 2020 | $4,008 | $264,440 | $85,000 | $179,440 |
| 2019 | $3,371 | $328,490 | $44,000 | $284,490 |
| 2018 | $3,458 | $296,880 | $44,000 | $252,880 |
| 2017 | $3,052 | $254,730 | $44,000 | $210,730 |
| 2016 | $3,403 | $254,730 | $44,000 | $210,730 |
| 2015 | $3,162 | $254,730 | $44,000 | $210,730 |
| 2014 | -- | $230,640 | $44,000 | $186,640 |
| 2013 | -- | $230,640 | $44,000 | $186,640 |
Source: Public Records
Map
Nearby Homes
- 1640 Palermo Ave
- 1557 Livorno Ave
- 1641 Brantingham Rd
- 430 Keene Rd
- 0 Keene Rd
- 1942 Sky Meadow Ave
- 1325 Brookwood Ave
- 652 Punkie Ln
- 2042 Morency Dr
- 204 Brookwood Loop
- 483 Aimee Dr
- 201 Ashwood St
- 1606 Elementary St
- 1644 Molly Marie Ave
- 2258 Morency Dr
- 3 Keene Rd Unit Lot 3
- 2 Keene Rd Unit Lot 2
- 1 Keene Rd Unit Lot 1
- 309 Falconridge St
- 1219 Brentwood Ave