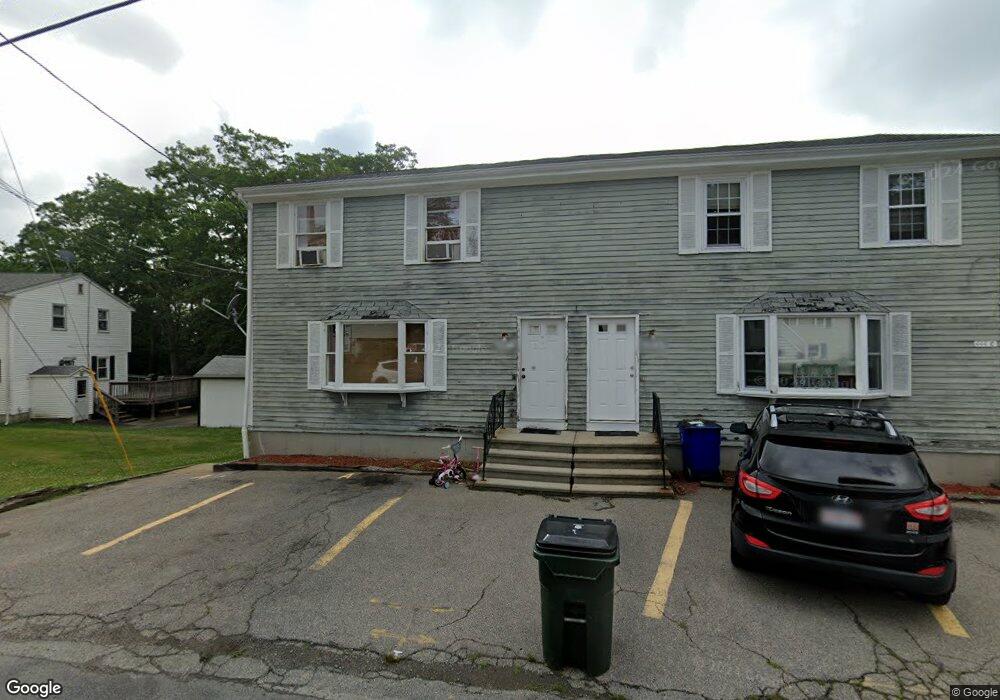
444 Quincy St Unit A Fall River, MA 02720
Western Fall River NeighborhoodEstimated Value: $313,000 - $551,000
3
Beds
2
Baths
1,970
Sq Ft
$210/Sq Ft
Est. Value
About This Home
This home is located at 444 Quincy St Unit A, Fall River, MA 02720 and is currently estimated at $413,335, approximately $209 per square foot. 444 Quincy St Unit A is a home located in Bristol County with nearby schools including North End Elementary School, Morton Middle School, and B M C Durfee High School.
Ownership History
Date
Name
Owned For
Owner Type
Purchase Details
Closed on
Feb 22, 1995
Sold by
Fnma
Bought by
Azevedo Joseph S
Current Estimated Value
Home Financials for this Owner
Home Financials are based on the most recent Mortgage that was taken out on this home.
Original Mortgage
$66,500
Interest Rate
9.17%
Mortgage Type
Purchase Money Mortgage
Purchase Details
Closed on
Jan 26, 1995
Sold by
Areias Jose G
Bought by
Federal National Mortgage Association
Home Financials for this Owner
Home Financials are based on the most recent Mortgage that was taken out on this home.
Original Mortgage
$66,500
Interest Rate
9.17%
Mortgage Type
Purchase Money Mortgage
Create a Home Valuation Report for This Property
The Home Valuation Report is an in-depth analysis detailing your home's value as well as a comparison with similar homes in the area
Home Values in the Area
Average Home Value in this Area
Purchase History
| Date | Buyer | Sale Price | Title Company |
|---|---|---|---|
| Azevedo Joseph S | $55,000 | -- | |
| Azevedo Joseph S | $55,000 | -- | |
| Federal National Mortgage Association | $61,625 | -- |
Source: Public Records
Mortgage History
| Date | Status | Borrower | Loan Amount |
|---|---|---|---|
| Closed | Azevedo Joseph S | $66,500 |
Source: Public Records
Tax History
| Year | Tax Paid | Tax Assessment Tax Assessment Total Assessment is a certain percentage of the fair market value that is determined by local assessors to be the total taxable value of land and additions on the property. | Land | Improvement |
|---|---|---|---|---|
| 2025 | $3,312 | $289,300 | $0 | $289,300 |
| 2024 | $3,241 | $282,100 | $0 | $282,100 |
| 2023 | $3,275 | $266,900 | $0 | $266,900 |
| 2022 | $3,149 | $250,300 | $0 | $250,300 |
| 2021 | $3,149 | $227,700 | $0 | $227,700 |
| 2020 | $2,958 | $204,700 | $0 | $204,700 |
| 2019 | $2,926 | $200,700 | $0 | $200,700 |
| 2018 | $2,702 | $184,800 | $0 | $184,800 |
| 2017 | $2,587 | $184,800 | $0 | $184,800 |
| 2016 | $2,447 | $179,500 | $0 | $179,500 |
| 2015 | $2,398 | $183,300 | $0 | $183,300 |
| 2014 | $2,485 | $197,500 | $0 | $197,500 |
Source: Public Records
Map
Nearby Homes
- 33 Warner St
- 257 Calvin St
- Parcel 2 Highcrest Rd
- 1810 Highland Ave Unit 22
- 29 Valentine St
- 274 Archer St
- 3636 N Main St Unit 5
- 195 Crescent St Unit 3
- 2106 Meridian St
- 108 Stowe St Unit 108
- 230 College Park Rd
- 201 Montgomery Cir
- 247 Albany St
- 210 Harrison Ave
- 2714 Riverside Ave
- 333 Langley St
- 1553 Riverside Ave
- 1496 Riverside Ave
- 17 Langley St
- 54 Grant Ave
- 444 Quincy St
- 444 Quincy St Unit B
- 444 Quincy St Unit C
- 456 Quincy St
- 150 Haskell St
- 140 Haskell St
- 451 Quincy St
- 166 Haskell St
- 478 Quincy St
- 478 Quincy St Unit C
- 478 Quincy St Unit 3
- 478 Quincy St Unit 1N
- 483 Quincy St
- 492 Quincy St
- 492 Quincy St Unit 3
- 492 Quincy St Unit 2
- 492 Quincy St Unit 1
- 499 Quincy St
- 204 Haskell St
- 504 Quincy St
Your Personal Tour Guide
Ask me questions while you tour the home.