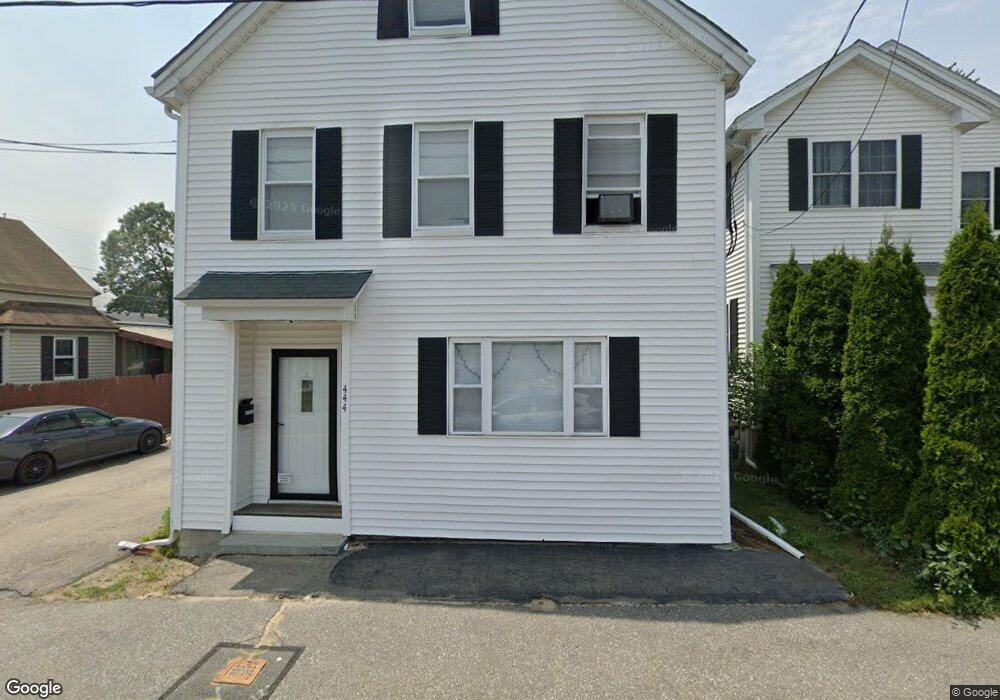
444 Riverside St Unit 1 Lowell, MA 01854
Pawtucketville NeighborhoodEstimated Value: $419,000 - $471,612
2
Beds
2
Baths
1,864
Sq Ft
$243/Sq Ft
Est. Value
About This Home
This home is located at 444 Riverside St Unit 1, Lowell, MA 01854 and is currently estimated at $452,903, approximately $242 per square foot. 444 Riverside St Unit 1 is a home located in Middlesex County with nearby schools including Joseph McAvinnue Elementary School, Charlotte M. Murkland Elementary School, and Charles W. Morey Elementary School.
Ownership History
Date
Name
Owned For
Owner Type
Purchase Details
Closed on
Mar 31, 2022
Sold by
Alex Kelsey Llc
Bought by
Batallas Mario W and Batallas Emma A
Current Estimated Value
Home Financials for this Owner
Home Financials are based on the most recent Mortgage that was taken out on this home.
Original Mortgage
$224,000
Outstanding Balance
$211,314
Interest Rate
4.67%
Mortgage Type
Purchase Money Mortgage
Estimated Equity
$241,589
Purchase Details
Closed on
Nov 17, 2014
Sold by
Puryear Pamela and Hsbc Bank Usa Na
Bought by
Alex Kelsey Llc
Purchase Details
Closed on
Jul 14, 2006
Sold by
Gjenco Llc
Bought by
Puryear Jeffrey and Puryear Pamela
Home Financials for this Owner
Home Financials are based on the most recent Mortgage that was taken out on this home.
Original Mortgage
$204,000
Interest Rate
6.71%
Mortgage Type
Purchase Money Mortgage
Create a Home Valuation Report for This Property
The Home Valuation Report is an in-depth analysis detailing your home's value as well as a comparison with similar homes in the area
Home Values in the Area
Average Home Value in this Area
Purchase History
| Date | Buyer | Sale Price | Title Company |
|---|---|---|---|
| Batallas Mario W | $280,000 | None Available | |
| Alex Kelsey Llc | $168,000 | -- | |
| Puryear Jeffrey | $255,000 | -- |
Source: Public Records
Mortgage History
| Date | Status | Borrower | Loan Amount |
|---|---|---|---|
| Open | Batallas Mario W | $224,000 | |
| Previous Owner | Puryear Jeffrey | $204,000 |
Source: Public Records
Tax History Compared to Growth
Tax History
| Year | Tax Paid | Tax Assessment Tax Assessment Total Assessment is a certain percentage of the fair market value that is determined by local assessors to be the total taxable value of land and additions on the property. | Land | Improvement |
|---|---|---|---|---|
| 2025 | $5,171 | $450,400 | $0 | $450,400 |
| 2024 | $4,866 | $408,600 | $0 | $408,600 |
| 2023 | $4,476 | $360,400 | $0 | $360,400 |
| 2022 | $4,247 | $334,700 | $0 | $334,700 |
| 2021 | $4,029 | $299,300 | $0 | $299,300 |
| 2020 | $3,870 | $289,700 | $0 | $289,700 |
| 2019 | $3,774 | $268,800 | $0 | $268,800 |
| 2018 | $3,343 | $246,300 | $0 | $246,300 |
| 2017 | $3,297 | $221,000 | $0 | $221,000 |
| 2016 | $3,106 | $204,900 | $0 | $204,900 |
| 2015 | $2,985 | $192,800 | $0 | $192,800 |
| 2013 | $2,912 | $194,000 | $0 | $194,000 |
Source: Public Records
Map
Nearby Homes
- 38-49 Casco St
- 87 New York St
- 118 Lafayette St
- 39 Phoebe Ave
- 146 Gershom Ave
- 14 Endicott St
- 74-76 Sladen St
- 73 Sladen St
- 37 Campaw St
- 37 Beaudry St
- 160 Avon St
- 113 5th Ave
- 91 Donohue Rd Unit 8
- 12 Fisher St
- 100 Cass Ave Unit A13
- 88 6th Ave
- 101 Donohue Rd Unit 19
- 45 Hoover St
- 81 5th Ave
- 15 Louis Farm Rd Unit 15
- 444 Riverside St Unit 2
- 444 Riverside St
- 446 Riverside St Unit 2
- 438 Riverside St
- 13 Jordan St
- 447 Riverside St
- 15 Jordan St Unit 2
- 15 Jordan St Unit 1
- 439 Riverside St
- 458 Riverside St
- 453 Riverside St
- 431 Riverside St
- 430 Riverside St
- 459 Riverside St
- 461 Riverside St
- 27 Jordan St
- 18 Bay St
- 12 Bay St
- 34 New York St Unit 43
- 466 Riverside St