Estimated Value: $467,481 - $577,000
4
Beds
3
Baths
2,598
Sq Ft
$198/Sq Ft
Est. Value
About This Home
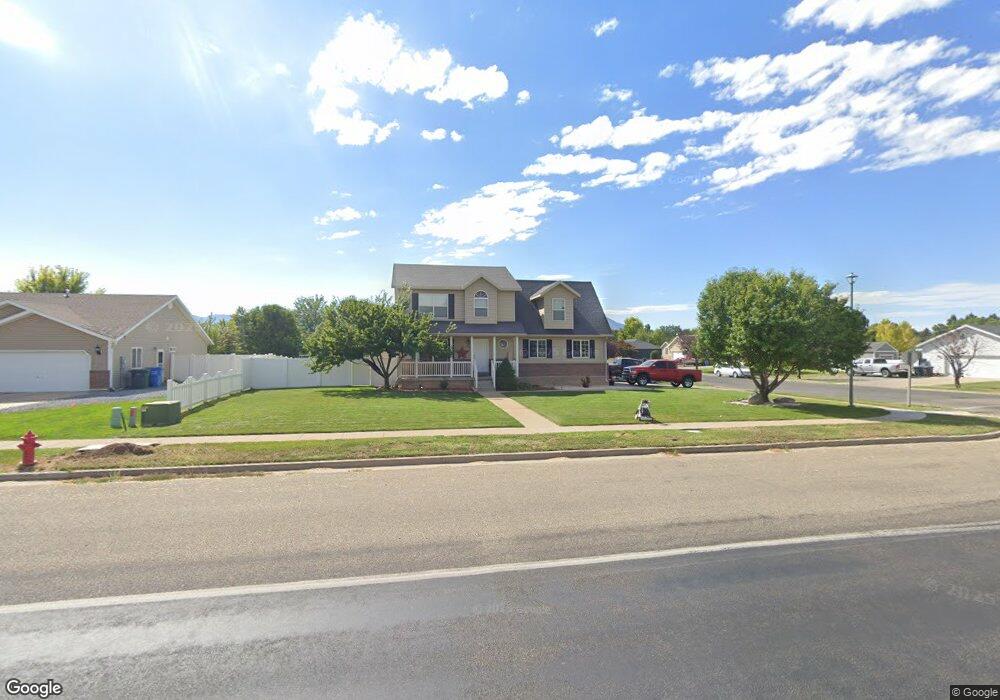
This home is located at 444 S 800 E, Hyrum, UT 84319 and is currently estimated at $513,870, approximately $197 per square foot. 444 S 800 E is a home located in Cache County with nearby schools including Millville School, South Cache Middle School, and Mountain Crest High School.
Ownership History
Date
Name
Owned For
Owner Type
Purchase Details
Closed on
Oct 10, 2019
Sold by
Butler Matthew H and Butler Julene J
Bought by
Linares Alfonso
Current Estimated Value
Home Financials for this Owner
Home Financials are based on the most recent Mortgage that was taken out on this home.
Original Mortgage
$301,919
Outstanding Balance
$263,912
Interest Rate
3.5%
Mortgage Type
New Conventional
Estimated Equity
$249,958
Purchase Details
Closed on
Jul 9, 2015
Sold by
Cooper Denis M and Cooper Sherleen B
Bought by
Butler Matthew H and Butler Julene J
Home Financials for this Owner
Home Financials are based on the most recent Mortgage that was taken out on this home.
Original Mortgage
$198,979
Interest Rate
3.85%
Mortgage Type
New Conventional
Purchase Details
Closed on
Feb 1, 2008
Sold by
Johnson Mekenzie C
Bought by
Cooper Denis M and Cooper Sherleen B
Home Financials for this Owner
Home Financials are based on the most recent Mortgage that was taken out on this home.
Original Mortgage
$104,000
Interest Rate
6.09%
Mortgage Type
New Conventional
Purchase Details
Closed on
Jan 24, 2008
Sold by
Johnson Landen H
Bought by
Johnson Mekenzie C
Home Financials for this Owner
Home Financials are based on the most recent Mortgage that was taken out on this home.
Original Mortgage
$104,000
Interest Rate
6.09%
Mortgage Type
New Conventional
Purchase Details
Closed on
Apr 1, 2007
Sold by
Mortgage Guaranty Insurance Corporation
Bought by
Johnson Mekenzie C and Johnson Landen H
Home Financials for this Owner
Home Financials are based on the most recent Mortgage that was taken out on this home.
Original Mortgage
$190,000
Interest Rate
6.11%
Mortgage Type
New Conventional
Purchase Details
Closed on
Feb 12, 2007
Sold by
Federal National Mortgage Association
Bought by
Mortgage Guaranty Insurance Corporation
Home Financials for this Owner
Home Financials are based on the most recent Mortgage that was taken out on this home.
Original Mortgage
$190,000
Interest Rate
6.11%
Mortgage Type
New Conventional
Purchase Details
Closed on
Jan 10, 2007
Sold by
Phelps David R and Phelps Ashley
Bought by
Federal National Mortgage Association
Create a Home Valuation Report for This Property
The Home Valuation Report is an in-depth analysis detailing your home's value as well as a comparison with similar homes in the area
Home Values in the Area
Average Home Value in this Area
Purchase History
| Date | Buyer | Sale Price | Title Company |
|---|---|---|---|
| Linares Alfonso | -- | American Secure Title Logan | |
| Butler Matthew H | -- | American Secure Title Logan | |
| Cooper Denis M | -- | Hickman Land Title Company | |
| Johnson Mekenzie C | -- | Hickman Land Title Company | |
| Johnson Mekenzie C | -- | Northern Title Company | |
| Mortgage Guaranty Insurance Corporation | -- | Northern Title Company | |
| Federal National Mortgage Association | $160,214 | Inwest Title Services |
Source: Public Records
Mortgage History
| Date | Status | Borrower | Loan Amount |
|---|---|---|---|
| Open | Linares Alfonso | $301,919 | |
| Previous Owner | Butler Matthew H | $198,979 | |
| Previous Owner | Cooper Denis M | $104,000 | |
| Previous Owner | Johnson Mekenzie C | $190,000 |
Source: Public Records
Tax History Compared to Growth
Tax History
| Year | Tax Paid | Tax Assessment Tax Assessment Total Assessment is a certain percentage of the fair market value that is determined by local assessors to be the total taxable value of land and additions on the property. | Land | Improvement |
|---|---|---|---|---|
| 2025 | $1,626 | $233,415 | $0 | $0 |
| 2024 | $173 | $232,220 | $0 | $0 |
| 2023 | $1,651 | $211,630 | $0 | $0 |
| 2022 | $1,723 | $211,630 | $0 | $0 |
| 2021 | $169 | $320,830 | $65,050 | $255,780 |
| 2020 | $1,517 | $269,474 | $65,050 | $204,424 |
| 2019 | $1,475 | $246,424 | $42,000 | $204,424 |
| 2018 | $1,361 | $219,760 | $42,000 | $177,760 |
| 2017 | $1,336 | $111,980 | $0 | $0 |
| 2016 | $1,366 | $111,980 | $0 | $0 |
| 2015 | $1,328 | $108,530 | $0 | $0 |
| 2014 | $1,285 | $107,430 | $0 | $0 |
| 2013 | -- | $107,430 | $0 | $0 |
Source: Public Records
Map
Nearby Homes