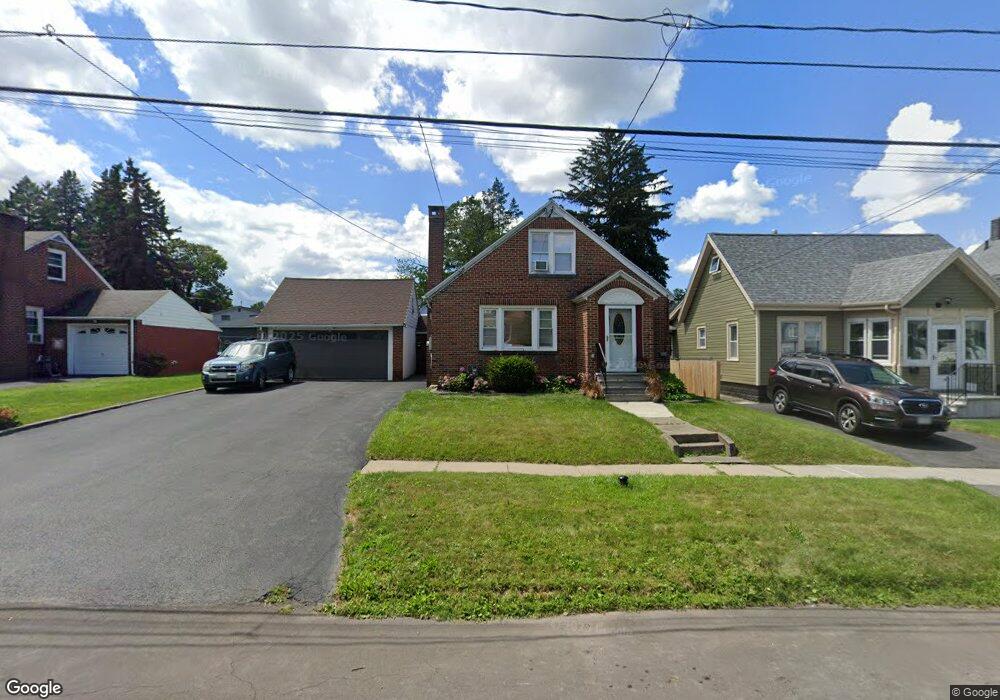
444 S Collingwood Ave Syracuse, NY 13206
Eastwood NeighborhoodEstimated Value: $207,000 - $235,572
3
Beds
2
Baths
1,865
Sq Ft
$119/Sq Ft
Est. Value
About This Home
This home is located at 444 S Collingwood Ave, Syracuse, NY 13206 and is currently estimated at $221,893, approximately $118 per square foot. 444 S Collingwood Ave is a home located in Onondaga County with nearby schools including Huntington K-8 School, Henninger High School, and Blessed Sacrament School.
Ownership History
Date
Name
Owned For
Owner Type
Purchase Details
Closed on
Jan 2, 2024
Sold by
Oates Buerin Est and Bellamy
Bought by
Buerin Gates T and Buerin Bellamy
Current Estimated Value
Purchase Details
Closed on
Dec 29, 2011
Sold by
Trust Carubia Joseph A & Mary Ann
Bought by
Oates Buerin
Home Financials for this Owner
Home Financials are based on the most recent Mortgage that was taken out on this home.
Original Mortgage
$70,000
Interest Rate
3.98%
Mortgage Type
New Conventional
Purchase Details
Closed on
Aug 2, 2011
Sold by
Carubia Antonio
Bought by
Carubia Maryann
Purchase Details
Closed on
Nov 17, 2009
Sold by
Carubia Irrevocable Trust Maryann & Joseph
Bought by
Carubia Antonio
Purchase Details
Closed on
Jan 10, 2002
Sold by
Carubia Joseph M and Carubia Mary
Bought by
Carubia Joseph A and Carubia Mary
Create a Home Valuation Report for This Property
The Home Valuation Report is an in-depth analysis detailing your home's value as well as a comparison with similar homes in the area
Home Values in the Area
Average Home Value in this Area
Purchase History
| Date | Buyer | Sale Price | Title Company |
|---|---|---|---|
| Buerin Gates T | -- | None Available | |
| Oates Buerin | $113,000 | Sheldon Kall | |
| Oates Buerin | $113,000 | Sheldon Kall | |
| Carubia Maryann | -- | -- | |
| Carubia Maryann | -- | -- | |
| Carubia Antonio | -- | -- | |
| Carubia Antonio | -- | -- | |
| Carubia Joseph A | -- | -- | |
| Carubia Joseph A | -- | -- |
Source: Public Records
Mortgage History
| Date | Status | Borrower | Loan Amount |
|---|---|---|---|
| Previous Owner | Oates Buerin | $70,000 |
Source: Public Records
Tax History Compared to Growth
Tax History
| Year | Tax Paid | Tax Assessment Tax Assessment Total Assessment is a certain percentage of the fair market value that is determined by local assessors to be the total taxable value of land and additions on the property. | Land | Improvement |
|---|---|---|---|---|
| 2024 | -- | $95,000 | $18,800 | $76,200 |
| 2023 | $1,506 | $95,000 | $18,800 | $76,200 |
| 2022 | $1,471 | $90,100 | $18,800 | $71,300 |
| 2021 | $1,471 | $90,100 | $18,800 | $71,300 |
| 2020 | $1,558 | $90,100 | $18,800 | $71,300 |
| 2019 | $3,530 | $90,100 | $18,800 | $71,300 |
| 2018 | $1,561 | $90,100 | $18,800 | $71,300 |
| 2017 | $1,509 | $90,100 | $18,800 | $71,300 |
| 2016 | $1,537 | $90,100 | $18,800 | $71,300 |
| 2015 | -- | $90,100 | $18,800 | $71,300 |
| 2014 | -- | $90,100 | $18,800 | $71,300 |
Source: Public Records
Map
Nearby Homes
- 373 S Collingwood Ave
- 405 S Edwards Ave
- 528 S Midler Ave
- 522 Woodbine Ave
- 316 S Midler Ave
- 125 Avon Rd
- 362 Hickok Ave
- 263 Homecroft Rd
- 321 Mosley Dr
- 1607 Burnet Ave
- 205 Shotwell Park Unit 100
- 140 Hillsdale Ave
- 140 S Collingwood Ave Unit 42
- 310 Vann St Unit 14
- 1512 Caleb Ave Unit 14
- 512 Boyden St
- 502 Boyden St
- 302 Melrose Ave
- 301 Melrose Ave
- 135 Plymouth Dr
- 448 S Collingwood Ave
- 440 S Collingwood Ave
- 456 S Collingwood Ave
- 436 S Collingwood Ave
- 449 Hillsdale Ave
- 441 Hillsdale Ave
- 453 Hillsdale Ave
- 460 S Collingwood Ave
- 432 S Collingwood Ave
- 437 Hillsdale Ave
- 428 S Collingwood Ave
- 461 Hillsdale Ave
- 449 S Collingwood Ave
- 445 S Collingwood Ave
- 453 S Collingwood Ave
- 457 Hillsdale Ave
- 457 S Collingwood Ave
- 433 Hillsdale Ave Unit 35
- 441 S Collingwood Ave
- 470 S Collingwood Ave