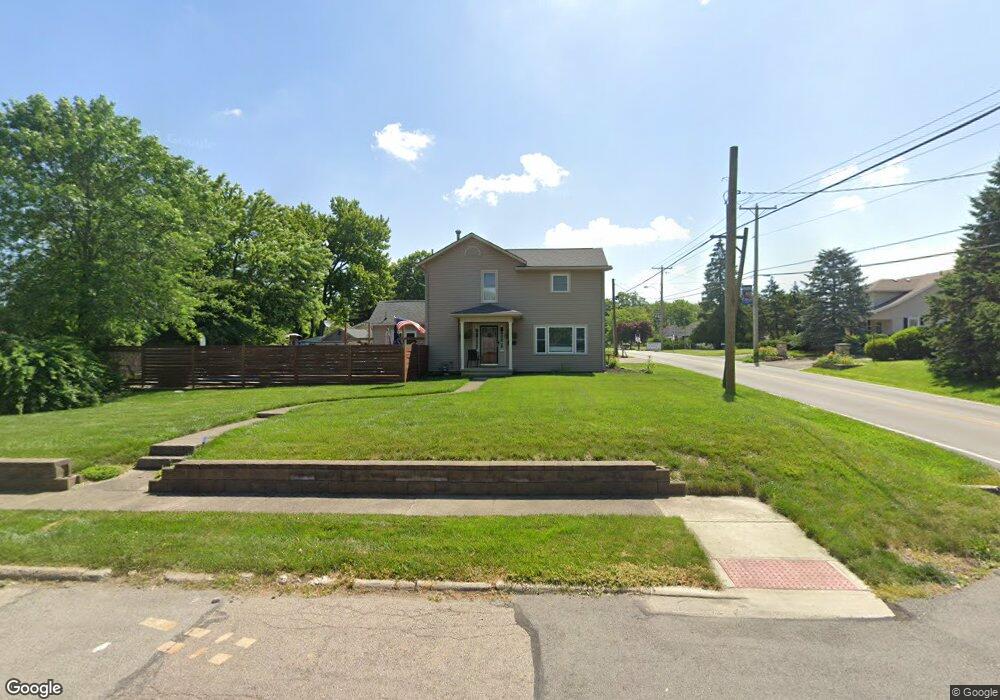
444 Sycamore St Brookville, OH 45309
Estimated Value: $205,093 - $254,000
3
Beds
1
Bath
1,904
Sq Ft
$119/Sq Ft
Est. Value
About This Home
This home is located at 444 Sycamore St, Brookville, OH 45309 and is currently estimated at $226,023, approximately $118 per square foot. 444 Sycamore St is a home located in Montgomery County with nearby schools including Brookville Elementary School, Brookville Intermediate School, and Brookville High School.
Ownership History
Date
Name
Owned For
Owner Type
Purchase Details
Closed on
Mar 25, 2002
Sold by
Crumrine Diana L
Bought by
Bruchs Patrick J and Bruchs Saundra
Current Estimated Value
Home Financials for this Owner
Home Financials are based on the most recent Mortgage that was taken out on this home.
Original Mortgage
$85,200
Outstanding Balance
$32,598
Interest Rate
5.87%
Estimated Equity
$193,425
Create a Home Valuation Report for This Property
The Home Valuation Report is an in-depth analysis detailing your home's value as well as a comparison with similar homes in the area
Home Values in the Area
Average Home Value in this Area
Purchase History
| Date | Buyer | Sale Price | Title Company |
|---|---|---|---|
| Bruchs Patrick J | $106,500 | Landmark Title Agency Inc |
Source: Public Records
Mortgage History
| Date | Status | Borrower | Loan Amount |
|---|---|---|---|
| Open | Bruchs Patrick J | $85,200 | |
| Closed | Bruchs Patrick J | $15,000 |
Source: Public Records
Tax History Compared to Growth
Tax History
| Year | Tax Paid | Tax Assessment Tax Assessment Total Assessment is a certain percentage of the fair market value that is determined by local assessors to be the total taxable value of land and additions on the property. | Land | Improvement |
|---|---|---|---|---|
| 2024 | $2,809 | $59,800 | $11,390 | $48,410 |
| 2023 | $2,809 | $59,800 | $11,390 | $48,410 |
| 2022 | $2,492 | $41,240 | $7,860 | $33,380 |
| 2021 | $2,503 | $41,240 | $7,860 | $33,380 |
| 2020 | $2,506 | $41,240 | $7,860 | $33,380 |
| 2019 | $2,214 | $33,330 | $7,860 | $25,470 |
| 2018 | $2,226 | $33,330 | $7,860 | $25,470 |
| 2017 | $2,215 | $33,330 | $7,860 | $25,470 |
| 2016 | $2,027 | $29,930 | $7,860 | $22,070 |
| 2015 | $1,995 | $29,930 | $7,860 | $22,070 |
| 2014 | $1,995 | $29,930 | $7,860 | $22,070 |
| 2012 | -- | $29,070 | $7,810 | $21,260 |
Source: Public Records
Map
Nearby Homes
- 401 Harper Creek Dr
- Norway Plan at Harper Creek
- Palmetto Plan at Harper Creek
- Aspen II Plan at Harper Creek
- Empress Plan at Harper Creek
- Bradford Plan at Harper Creek
- Spruce Plan at Harper Creek
- Ironwood Plan at Harper Creek
- Juniper Plan at Harper Creek
- Chestnut Plan at Harper Creek
- Cooper Plan at Harper Creek
- 4 E Mckinley St
- 214 Hay Ave
- Chestnut Plan at Evergreen Trace
- Palmetto Plan at Evergreen Trace
- Aspen II Plan at Evergreen Trace
- Empress Plan at Evergreen Trace
- Ashton Plan at Evergreen Trace
- Norway Plan at Evergreen Trace
- Bradford Plan at Evergreen Trace
- 125 E Westbrook Rd
- 434 Sycamore St
- 200 E Westbrook Rd
- 211 E Westbrook Rd
- 445 Sycamore St
- 206 E Westbrook Rd
- 436 Poplar St
- 118 E Westbrook Rd
- 430 Poplar St
- 217 E Westbrook Rd
- 423 Sycamore St
- 420 Sycamore St
- 459 Maple St
- 223 E Westbrook Rd
- 451 Maple St
- 400 Sycamore St
- 424 Poplar St
- 437 Maple St
- 224 E Westbrook Rd
- 429 Maple St