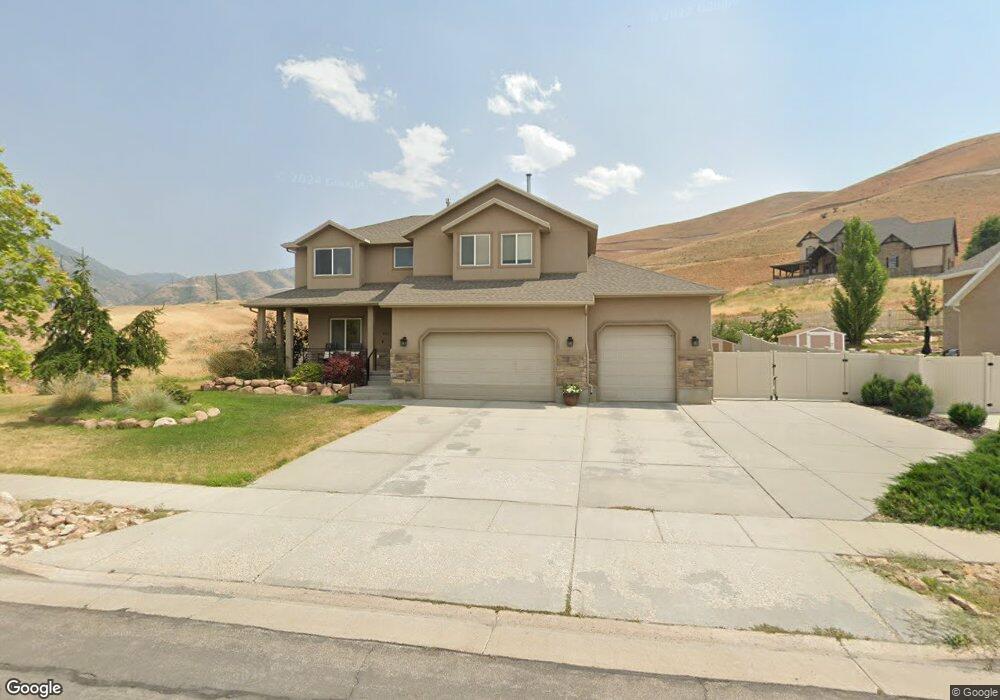
444 Tamarack Dr Tooele, UT 84074
Estimated Value: $540,000 - $704,000
--
Bed
--
Bath
3,237
Sq Ft
$181/Sq Ft
Est. Value
About This Home
This home is located at 444 Tamarack Dr, Tooele, UT 84074 and is currently estimated at $586,727, approximately $181 per square foot. 444 Tamarack Dr is a home located in Tooele County with nearby schools including Sterling Elementary School, Tooele Junior High School, and Tooele High School.
Ownership History
Date
Name
Owned For
Owner Type
Purchase Details
Closed on
Jul 6, 2007
Sold by
Onederra Vicki and Onederra Jon
Bought by
Strege Robert and Strege Heidi
Current Estimated Value
Home Financials for this Owner
Home Financials are based on the most recent Mortgage that was taken out on this home.
Original Mortgage
$312,450
Outstanding Balance
$194,372
Interest Rate
6.41%
Mortgage Type
New Conventional
Estimated Equity
$392,355
Purchase Details
Closed on
Jul 31, 2006
Sold by
Smith Sam
Bought by
Onederra Vicki and Onederra Jon
Home Financials for this Owner
Home Financials are based on the most recent Mortgage that was taken out on this home.
Original Mortgage
$290,000
Interest Rate
6.57%
Mortgage Type
Unknown
Purchase Details
Closed on
Jul 14, 2006
Sold by
Delia Serge M and Delia Lillian Csl
Bought by
Smith Sam
Home Financials for this Owner
Home Financials are based on the most recent Mortgage that was taken out on this home.
Original Mortgage
$290,000
Interest Rate
6.57%
Mortgage Type
Unknown
Create a Home Valuation Report for This Property
The Home Valuation Report is an in-depth analysis detailing your home's value as well as a comparison with similar homes in the area
Home Values in the Area
Average Home Value in this Area
Purchase History
| Date | Buyer | Sale Price | Title Company |
|---|---|---|---|
| Strege Robert | -- | First American Title Agency | |
| Onederra Vicki | -- | First American Title Insu | |
| Smith Sam | -- | Security Title |
Source: Public Records
Mortgage History
| Date | Status | Borrower | Loan Amount |
|---|---|---|---|
| Open | Strege Robert | $312,450 | |
| Previous Owner | Onederra Vicki | $290,000 |
Source: Public Records
Tax History Compared to Growth
Tax History
| Year | Tax Paid | Tax Assessment Tax Assessment Total Assessment is a certain percentage of the fair market value that is determined by local assessors to be the total taxable value of land and additions on the property. | Land | Improvement |
|---|---|---|---|---|
| 2025 | $3,570 | $297,777 | $77,550 | $220,227 |
| 2024 | $3,737 | $285,244 | $77,550 | $207,694 |
| 2023 | $3,737 | $291,805 | $73,948 | $217,857 |
| 2022 | $3,782 | $325,352 | $73,948 | $251,404 |
| 2021 | $3,328 | $239,499 | $30,147 | $209,352 |
| 2020 | $3,489 | $435,453 | $54,813 | $380,640 |
| 2019 | $3,546 | $435,453 | $54,813 | $380,640 |
| 2018 | $3,329 | $387,576 | $65,000 | $322,576 |
| 2017 | $2,297 | $317,331 | $40,000 | $277,331 |
| 2016 | $1,867 | $154,636 | $22,000 | $132,636 |
| 2015 | $1,867 | $135,775 | $0 | $0 |
| 2014 | -- | $135,775 | $0 | $0 |
Source: Public Records
Map
Nearby Homes
- 624 Mountaineer Cir
- 299 Sage Cir
- 363 Oak Hill Dr
- 250 E Broadway St
- 557 Elk Meadow Loop
- 702 Elk Meadow Loop
- 426 S Deer Hollow Dr
- 5 S Bench Mark Village Unit 5
- 704 S Deer Hollow Dr
- 265 E Serenity Ave Unit 1004
- 7967 N Spring Valley Ln Unit 321
- 1918 N Patchwork Ave
- 524 Oak Ln Unit 3
- 558 Oak Ln
- 11 Benchmark Village
- 851 E Oak Ct Unit 28
- 134 S 4th St
- 584 S Oak Ln
- 702 Oakridge Dr Unit 701
- 775 Elk Meadow Loop
- 444 Meadows Dr
- 444 Meadows Dr Unit 30
- 468 Tamarack Dr
- 453 Tamarack Dr
- 432 Tamarack Dr
- 432 Meadows Dr Unit 29
- 432 Meadows Dr Unit 29
- 453 Meadows Dr Unit 31
- 441 Meadows Dr Unit 32
- 441 Meadows Dr Unit 32
- 441 Meadows Dr Unit 32
- 441 Meadows Dr Unit 32
- 441 Tamarack Dr
- 429 Tamarack Dr
- 429 Meadows Dr Unit 33
- 522 Tamarack Dr
- 522 Tamarack Dr Unit 2
- 424 Meadows Dr Unit 28
- 424 Tamarack Dr
- 495 Tamarack Dr Unit 1