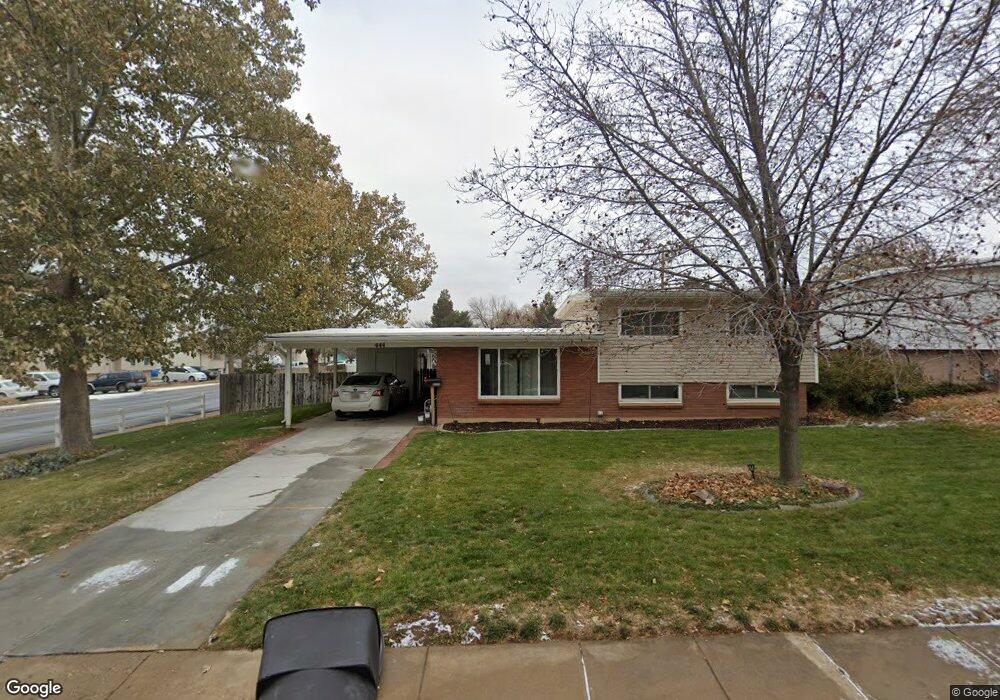
444 W 2200 N Clearfield, UT 84015
Estimated Value: $361,000 - $396,000
4
Beds
2
Baths
1,554
Sq Ft
$242/Sq Ft
Est. Value
About This Home
This home is located at 444 W 2200 N, Clearfield, UT 84015 and is currently estimated at $376,060, approximately $241 per square foot. 444 W 2200 N is a home located in Davis County with nearby schools including Sunset School, Sunset Junior High School, and Northridge High School.
Ownership History
Date
Name
Owned For
Owner Type
Purchase Details
Closed on
May 24, 2021
Sold by
Morris Jeremy J and Morris Jana T
Bought by
Morris Jana T and Morris Jeremy J
Current Estimated Value
Home Financials for this Owner
Home Financials are based on the most recent Mortgage that was taken out on this home.
Original Mortgage
$182,350
Outstanding Balance
$164,996
Interest Rate
3%
Mortgage Type
New Conventional
Estimated Equity
$211,064
Purchase Details
Closed on
Aug 18, 2016
Sold by
Mackay Jennifer and Mackay Nathan
Bought by
Morris Jana T and Morris Jeremy J
Purchase Details
Closed on
Apr 14, 2014
Sold by
Hackwell Gary J and Hackwell Rane
Bought by
Mackay Nathan and Mackay Jennifer
Home Financials for this Owner
Home Financials are based on the most recent Mortgage that was taken out on this home.
Original Mortgage
$5,891
Interest Rate
4.23%
Mortgage Type
Stand Alone Second
Create a Home Valuation Report for This Property
The Home Valuation Report is an in-depth analysis detailing your home's value as well as a comparison with similar homes in the area
Home Values in the Area
Average Home Value in this Area
Purchase History
| Date | Buyer | Sale Price | Title Company |
|---|---|---|---|
| Morris Jana T | -- | North American Title | |
| Morris Jana T | -- | Backman Title Services | |
| Mackay Nathan | -- | Us Title Company Of U |
Source: Public Records
Mortgage History
| Date | Status | Borrower | Loan Amount |
|---|---|---|---|
| Open | Morris Jana T | $182,350 | |
| Previous Owner | Mackay Nathan | $5,891 | |
| Previous Owner | Mackay Nathan | $147,295 |
Source: Public Records
Tax History Compared to Growth
Tax History
| Year | Tax Paid | Tax Assessment Tax Assessment Total Assessment is a certain percentage of the fair market value that is determined by local assessors to be the total taxable value of land and additions on the property. | Land | Improvement |
|---|---|---|---|---|
| 2025 | $2,002 | $182,600 | $72,136 | $110,464 |
| 2024 | $1,827 | $166,650 | $68,940 | $97,710 |
| 2023 | $1,713 | $285,000 | $109,974 | $175,026 |
| 2022 | $1,814 | $163,350 | $62,746 | $100,604 |
| 2021 | $1,576 | $223,000 | $68,374 | $154,626 |
| 2020 | $1,373 | $191,000 | $57,834 | $133,166 |
| 2019 | $1,289 | $184,000 | $72,199 | $111,801 |
| 2018 | $1,138 | $159,000 | $57,698 | $101,302 |
| 2016 | $978 | $70,235 | $27,288 | $42,947 |
| 2015 | $952 | $64,735 | $27,288 | $37,447 |
| 2014 | $875 | $60,816 | $27,288 | $33,528 |
| 2013 | -- | $61,619 | $23,265 | $38,354 |
Source: Public Records
Map
Nearby Homes
- 2177 N 450 W
- 648 W 2200 N
- 2512 N 475 W
- 2382 N 770 W
- 389 W 2575 N
- 2486 N 690 W
- 2593 N 500 W Unit 56
- 350 W 2575 N
- 2612 N 525 W
- 2085 N Main St Unit 409
- 2085 N Main St Unit 108
- 2085 N Main St Unit 401
- 2085 N Main St Unit 308
- 2085 N Main St Unit 116
- 2085 N Main St Unit 201
- 2085 N Main St Unit 402
- 2085 N Main St Unit 202
- 2085 N Main St Unit 301
- 2085 N Main St Unit 302
- 2085 N Main St Unit 115