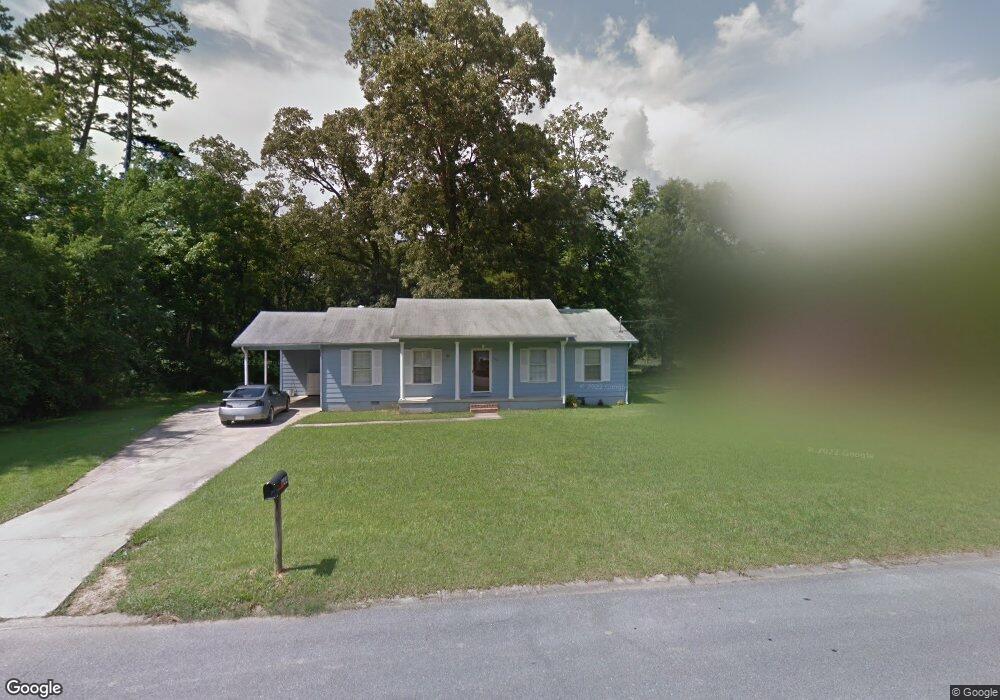
444 W Jule Peek Ave Cedartown, GA 30125
Estimated Value: $174,000 - $209,658
3
Beds
2
Baths
1,323
Sq Ft
$144/Sq Ft
Est. Value
About This Home
This home is located at 444 W Jule Peek Ave, Cedartown, GA 30125 and is currently estimated at $190,165, approximately $143 per square foot. 444 W Jule Peek Ave is a home located in Polk County with nearby schools including Cedar Christian School and Vineyard Harvester Christian Academy.
Ownership History
Date
Name
Owned For
Owner Type
Purchase Details
Closed on
Dec 22, 2009
Sold by
Homesales Inc
Bought by
Salgado J Guadalupe
Current Estimated Value
Purchase Details
Closed on
Oct 6, 2009
Sold by
Watson Kye
Bought by
Homesales Inc
Purchase Details
Closed on
Feb 8, 2008
Sold by
Cook Thomas E
Bought by
Watson Kye
Home Financials for this Owner
Home Financials are based on the most recent Mortgage that was taken out on this home.
Original Mortgage
$86,575
Interest Rate
5.85%
Mortgage Type
New Conventional
Purchase Details
Closed on
Jan 23, 1987
Sold by
Kelley Everett and Kelley Nna
Bought by
Cook Thomas E
Purchase Details
Closed on
Mar 19, 1981
Sold by
Holbrooks Randy
Bought by
Kelley Everett
Purchase Details
Closed on
Dec 15, 1978
Sold by
Mccray D L Home Bld
Bought by
Holbrooks Randy P
Purchase Details
Closed on
Jun 30, 1977
Bought by
Mccray D L Home Bld
Create a Home Valuation Report for This Property
The Home Valuation Report is an in-depth analysis detailing your home's value as well as a comparison with similar homes in the area
Home Values in the Area
Average Home Value in this Area
Purchase History
| Date | Buyer | Sale Price | Title Company |
|---|---|---|---|
| Salgado J Guadalupe | -- | -- | |
| Homesales Inc | $67,523 | -- | |
| Watson Kye | $84,900 | -- | |
| Watson Kye | -- | -- | |
| Cook Thomas E | $38,900 | -- | |
| Kelley Everett | -- | -- | |
| Holbrooks Randy P | -- | -- | |
| Mccray D L Home Bld | -- | -- |
Source: Public Records
Mortgage History
| Date | Status | Borrower | Loan Amount |
|---|---|---|---|
| Previous Owner | Watson Kye | $86,575 |
Source: Public Records
Tax History Compared to Growth
Tax History
| Year | Tax Paid | Tax Assessment Tax Assessment Total Assessment is a certain percentage of the fair market value that is determined by local assessors to be the total taxable value of land and additions on the property. | Land | Improvement |
|---|---|---|---|---|
| 2024 | $2,442 | $77,326 | $5,600 | $71,726 |
| 2023 | $1,338 | $38,590 | $3,200 | $35,390 |
| 2022 | $801 | $33,742 | $3,200 | $30,542 |
| 2021 | $811 | $33,742 | $3,200 | $30,542 |
| 2020 | $813 | $33,742 | $3,200 | $30,542 |
| 2019 | $803 | $29,895 | $2,766 | $27,129 |
| 2018 | $802 | $29,122 | $2,766 | $26,356 |
| 2017 | $793 | $29,122 | $2,766 | $26,356 |
| 2016 | $733 | $26,941 | $2,766 | $24,174 |
| 2015 | $742 | $27,183 | $2,766 | $24,417 |
| 2014 | $692 | $27,183 | $2,766 | $24,417 |
Source: Public Records
Map
Nearby Homes
- 440 W Jule Peek Ave
- 447 W Jule Peek Ave
- 451 W Jule Peek Ave
- 0 W Jule Peek Ave
- W W Jule Peek Ave
- 443 W Jule Peek Ave
- 100 Ronnie Rd
- 104 Ronnie Rd
- 00 Ronnie Rd
- 439 W Jule Peek Ave
- 0 Ronnie Rd Unit 75,76,105,6 7434790
- 0 Ronnie Rd Unit 7524596
- 0 Ronnie Rd Unit PT LOT 107 7553058
- 108 Ronnie Rd Unit 76
- 108 Ronnie Rd
- 456 W Jule Peek Ave
- 459 W Jule Peek Ave
- 435 W Jule Peek Ave
- 460 W Jule Peek Ave
- 566 Pine St