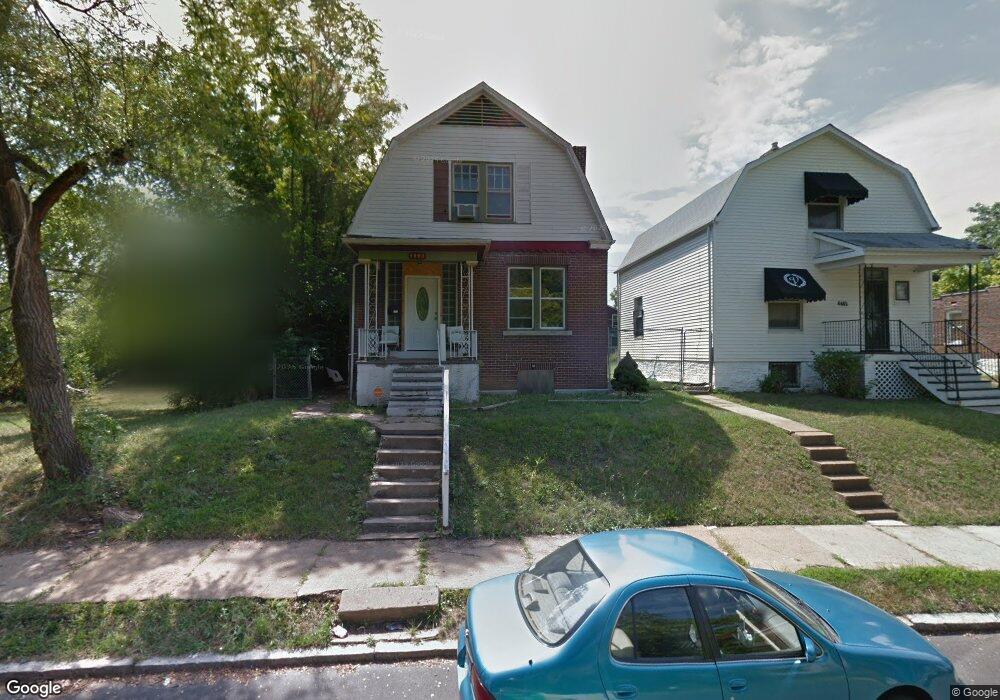
4440 Anderson Ave Saint Louis, MO 63115
Penrose NeighborhoodEstimated Value: $50,786 - $93,000
3
Beds
2
Baths
1,568
Sq Ft
$47/Sq Ft
Est. Value
About This Home
This home is located at 4440 Anderson Ave, Saint Louis, MO 63115 and is currently estimated at $73,447, approximately $46 per square foot. 4440 Anderson Ave is a home located in St. Louis City with nearby schools including Ashland Elementary School, Yeatman-Liddell Middle School, and Vashon High School.
Ownership History
Date
Name
Owned For
Owner Type
Purchase Details
Closed on
Jun 25, 2019
Sold by
Krough Sharon K
Bought by
Krough John Russell
Current Estimated Value
Purchase Details
Closed on
Feb 15, 2011
Sold by
Fannie Mae
Bought by
Krough Sharon K
Purchase Details
Closed on
Oct 22, 2010
Sold by
Phh Mortgage Corporation
Bought by
Federal National Mortgage Association
Purchase Details
Closed on
Oct 18, 2010
Sold by
Nelson Calvin L
Bought by
Phh Mortgage Corporation
Purchase Details
Closed on
Nov 2, 2004
Sold by
Robinson Thurlester
Bought by
Nelson Calvin
Purchase Details
Closed on
Jul 28, 2004
Sold by
Nations Credit Financial Services Corp
Bought by
Robinson Thurlester
Purchase Details
Closed on
Feb 20, 2004
Sold by
Shelby Jimmy and Shelby Phyllis
Bought by
Nationscredit Financial Services Corp
Create a Home Valuation Report for This Property
The Home Valuation Report is an in-depth analysis detailing your home's value as well as a comparison with similar homes in the area
Home Values in the Area
Average Home Value in this Area
Purchase History
| Date | Buyer | Sale Price | Title Company |
|---|---|---|---|
| Krough John Russell | -- | None Available | |
| Krough Sharon K | -- | None Available | |
| Federal National Mortgage Association | -- | None Available | |
| Phh Mortgage Corporation | $68,686 | None Available | |
| Nelson Calvin | -- | -- | |
| Robinson Thurlester | -- | -- | |
| Nationscredit Financial Services Corp | $35,764 | -- |
Source: Public Records
Tax History Compared to Growth
Tax History
| Year | Tax Paid | Tax Assessment Tax Assessment Total Assessment is a certain percentage of the fair market value that is determined by local assessors to be the total taxable value of land and additions on the property. | Land | Improvement |
|---|---|---|---|---|
| 2025 | $319 | $3,600 | $340 | $3,260 |
| 2024 | $305 | $3,480 | $340 | $3,140 |
| 2023 | $305 | $3,480 | $340 | $3,140 |
| 2022 | $311 | $3,420 | $340 | $3,080 |
| 2021 | $310 | $3,420 | $340 | $3,080 |
| 2020 | $308 | $3,420 | $340 | $3,080 |
| 2019 | $307 | $3,420 | $340 | $3,080 |
| 2018 | $319 | $3,460 | $340 | $3,120 |
| 2017 | $314 | $3,460 | $340 | $3,120 |
| 2016 | $318 | $3,460 | $670 | $2,790 |
| 2015 | $291 | $3,460 | $670 | $2,790 |
| 2014 | $355 | $3,460 | $670 | $2,790 |
| 2013 | -- | $4,320 | $670 | $3,650 |
Source: Public Records
Map
Nearby Homes
- 4449 Anderson Ave
- 4477 Bessie Ave
- 4246 N Taylor Ave
- 4418 Dryden Ave
- 4499 Lee Ave Unit B
- 4556 Carter Ave
- 4402 Clarence Ave
- 4253 Holly Ave
- 4237 Holly Ave
- 4627 Korte Ave
- 4607 Lee Ave
- 4419 Holly Ave
- 4429 Farlin Ave
- 4655 Lee Ave
- 4450 Holly Ave
- 4608 Pope Ave
- 4454 Holly Ave
- 4610 Pope Ave
- 3003 TAYOR N Taylor Ave
- 4219 Red Bud Ave
- 4442 Anderson Ave
- 4444 Anderson Ave
- 4448 Anderson Ave
- 4439 Bessie Ave
- 4441 Bessie Ave
- 4437 Bessie Ave
- 4452 Anderson Ave
- 4433 Bessie Ave
- 4429 Bessie Ave
- 4443 Anderson Ave
- 4427 Bessie Ave
- 4449 Bessie Ave
- 4445 Bessie Ave
- 4458 Anderson Ave
- 4425 Bessie Ave
- 4431 Anderson Ave
- 4429 Anderson Ave
- 4455 Bessie Ave
- 4460 Anderson Ave
- 4457 Bessie Ave