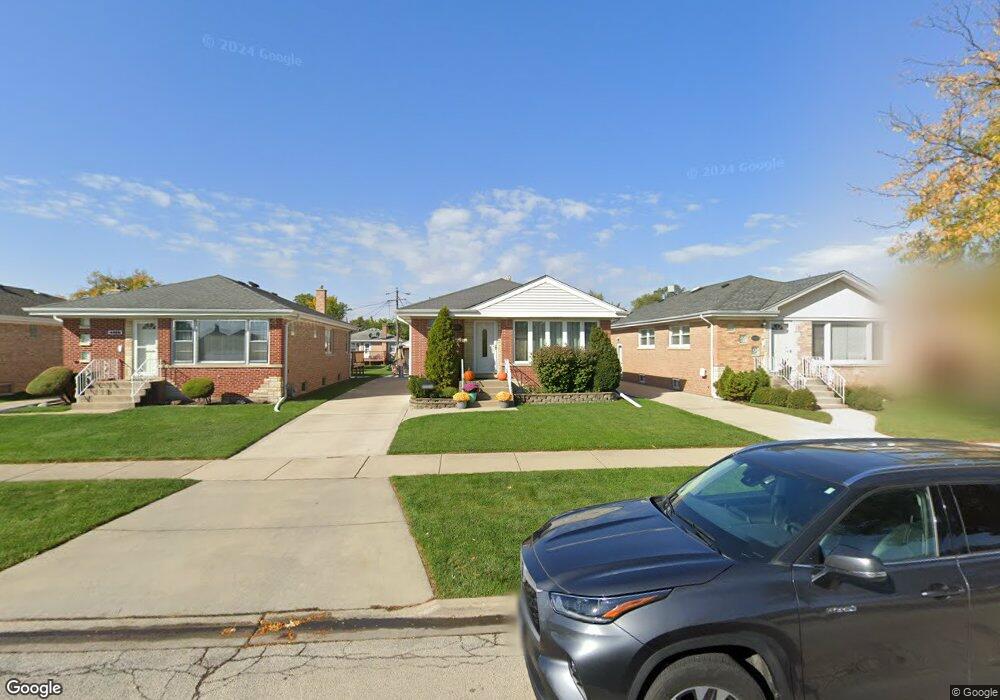
4440 N Osage Ave Norridge, IL 60706
Estimated Value: $394,559 - $449,000
3
Beds
1
Bath
1,087
Sq Ft
$390/Sq Ft
Est. Value
About This Home
This home is located at 4440 N Osage Ave, Norridge, IL 60706 and is currently estimated at $423,890, approximately $389 per square foot. 4440 N Osage Ave is a home located in Cook County with nearby schools including J Leigh Elementary School, Ridgewood Community High School, and St Eugene School.
Ownership History
Date
Name
Owned For
Owner Type
Purchase Details
Closed on
Jun 8, 2011
Sold by
Touhy Roger D and Touhy Julie F
Bought by
Touhy Roger D and Touhy Julie F
Current Estimated Value
Home Financials for this Owner
Home Financials are based on the most recent Mortgage that was taken out on this home.
Original Mortgage
$218,911
Outstanding Balance
$150,416
Interest Rate
4.56%
Mortgage Type
New Conventional
Estimated Equity
$273,474
Purchase Details
Closed on
Jul 4, 2001
Sold by
Talarico Frank
Bought by
Ferraro Julie and Touhy Roger D
Home Financials for this Owner
Home Financials are based on the most recent Mortgage that was taken out on this home.
Original Mortgage
$221,000
Interest Rate
7.14%
Purchase Details
Closed on
Dec 2, 1994
Sold by
Parkway Bank & Trust Company
Bought by
Talarico Frank
Create a Home Valuation Report for This Property
The Home Valuation Report is an in-depth analysis detailing your home's value as well as a comparison with similar homes in the area
Home Values in the Area
Average Home Value in this Area
Purchase History
| Date | Buyer | Sale Price | Title Company |
|---|---|---|---|
| Touhy Roger D | -- | Cti | |
| Ferraro Julie | $260,000 | -- | |
| Talarico Frank | $185,000 | -- |
Source: Public Records
Mortgage History
| Date | Status | Borrower | Loan Amount |
|---|---|---|---|
| Open | Touhy Roger D | $218,911 | |
| Closed | Ferraro Julie | $221,000 | |
| Closed | Ferraro Julie | $12,900 |
Source: Public Records
Tax History Compared to Growth
Tax History
| Year | Tax Paid | Tax Assessment Tax Assessment Total Assessment is a certain percentage of the fair market value that is determined by local assessors to be the total taxable value of land and additions on the property. | Land | Improvement |
|---|---|---|---|---|
| 2024 | $6,429 | $29,933 | $6,552 | $23,381 |
| 2023 | $6,647 | $31,215 | $6,552 | $24,663 |
| 2022 | $6,647 | $33,000 | $6,552 | $26,448 |
| 2021 | $5,639 | $25,498 | $5,796 | $19,702 |
| 2020 | $5,552 | $25,498 | $5,796 | $19,702 |
| 2019 | $5,537 | $28,617 | $5,796 | $22,821 |
| 2018 | $5,278 | $24,098 | $4,788 | $19,310 |
| 2017 | $5,163 | $24,098 | $4,788 | $19,310 |
| 2016 | $5,072 | $24,098 | $4,788 | $19,310 |
| 2015 | $4,915 | $21,922 | $4,158 | $17,764 |
| 2014 | $4,855 | $21,922 | $4,158 | $17,764 |
| 2013 | $4,742 | $21,922 | $4,158 | $17,764 |
Source: Public Records
Map
Nearby Homes
- 4436 N Osage Ave
- 4545 N Osage Ave
- 4404 N Opal Ave
- 4621 N Ozanam Ave
- 8025 W Giddings St
- 4236 N Ozark Ave
- 4712 N Ozark Ave
- 7906 W Lawrence Ave Unit F
- 4304 N Oriole Ave
- 4212 N Ottawa Ave
- 4224 N Oriole Ave
- 4846 N Crescent Ave
- 8268 W Lawrence Ave
- 7650 W Lawrence Ave Unit 201
- 4935 N Frank Pkwy
- 7616 W Lawrence Ave Unit 3A
- 4042 N Overhill Ave
- 4600 N Cumberland Ave Unit 314
- 8423 W Wilson Ave
- 8434 W Brodman Ave
- 4444 N Osage Ave
- 4432 N Osage Ave
- 4448 N Osage Ave
- 4428 N Osage Ave
- 4452 N Osage Ave
- 4441 N Canfield Ave
- 4445 N Canfield Ave
- 4437 N Canfield Ave
- 4449 N Canfield Ave
- 4433 N Canfield Ave
- 4424 N Osage Ave
- 4456 N Osage Ave
- 4429 N Canfield Ave
- 4441 N Osage Ave
- 4437 N Osage Ave
- 4420 N Osage Ave
- 4500 N Osage Ave
- 4445 N Osage Ave
- 4457 N Canfield Ave
- 4433 N Osage Ave