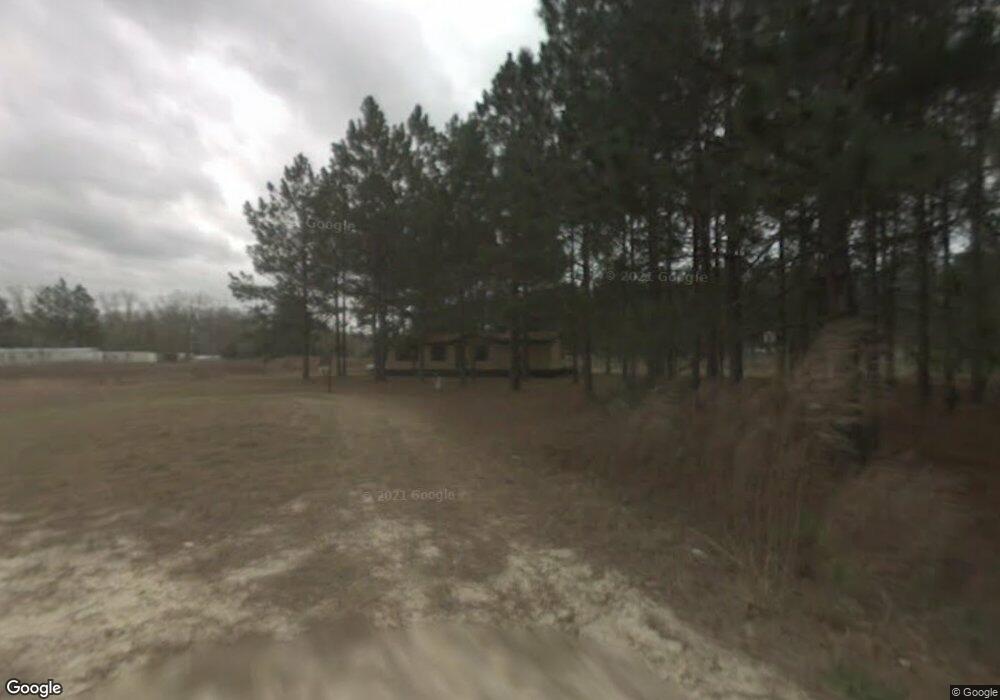
4441 Mockingbird Ln Waycross, GA 31503
Estimated Value: $141,478 - $194,000
3
Beds
2
Baths
1,248
Sq Ft
$133/Sq Ft
Est. Value
About This Home
This home is located at 4441 Mockingbird Ln, Waycross, GA 31503 and is currently estimated at $165,870, approximately $132 per square foot. 4441 Mockingbird Ln is a home located in Ware County with nearby schools including Wacona Elementary School, Ware County Middle School, and Ware County High School.
Ownership History
Date
Name
Owned For
Owner Type
Purchase Details
Closed on
Apr 13, 2007
Sold by
Millwood Plantation Llc
Bought by
Czerkawski Joseph J and Estell Reginald
Current Estimated Value
Purchase Details
Closed on
Mar 13, 2007
Sold by
Kurtz James D
Bought by
Kurtz Robin Lee
Purchase Details
Closed on
Mar 3, 1999
Sold by
Kurtz James D and Kurtz Conn
Bought by
Kurtz James D
Purchase Details
Closed on
Aug 17, 1993
Bought by
Kurtz James D and Kurtz Conn
Purchase Details
Closed on
Jan 26, 1990
Bought by
Bennett Adron and Bennett
Create a Home Valuation Report for This Property
The Home Valuation Report is an in-depth analysis detailing your home's value as well as a comparison with similar homes in the area
Home Values in the Area
Average Home Value in this Area
Purchase History
| Date | Buyer | Sale Price | Title Company |
|---|---|---|---|
| Czerkawski Joseph J | $166,155 | -- | |
| Kurtz Robin Lee | -- | -- | |
| Kurtz James D | -- | -- | |
| Kurtz James D | $3,900 | -- | |
| Bennett Adron | -- | -- |
Source: Public Records
Tax History Compared to Growth
Tax History
| Year | Tax Paid | Tax Assessment Tax Assessment Total Assessment is a certain percentage of the fair market value that is determined by local assessors to be the total taxable value of land and additions on the property. | Land | Improvement |
|---|---|---|---|---|
| 2024 | $497 | $34,966 | $11,450 | $23,516 |
| 2023 | $507 | $25,354 | $8,330 | $17,024 |
| 2022 | $544 | $25,108 | $8,330 | $16,778 |
| 2021 | $461 | $18,597 | $8,330 | $10,267 |
| 2020 | $458 | $18,151 | $8,330 | $9,821 |
| 2019 | $460 | $17,704 | $8,330 | $9,374 |
| 2018 | $457 | $17,258 | $8,330 | $8,928 |
| 2017 | $456 | $17,258 | $8,330 | $8,928 |
| 2016 | $456 | $17,258 | $8,330 | $8,928 |
| 2015 | $460 | $17,258 | $8,330 | $8,928 |
| 2014 | $460 | $17,258 | $8,330 | $8,928 |
| 2013 | -- | $17,258 | $8,330 | $8,928 |
Source: Public Records
Map
Nearby Homes
- 4190 Church Street Extension
- 4167 Jamestown Rd
- 3825 Jamestown Rd
- 1691 Huckaby Rd
- 3860 Blalock Ave
- 3648 Tanner Ln
- 1621 Meadowood Dr
- 5802 River Trail
- 123 Winn Clay Dr
- 5768 Holly Dr
- 5927 Yellow Bluff Rd
- 06 Alton Cir
- 03 Alton Cir
- 02 Alton Cir
- 04 Alton Cir
- 01 Alton Cir
- 4601 Alma Hwy
- Tract 2,3 Stetson Dr
- 2508 Mesa Rd
- 6005 & 6007 Tree Top Ln
- 4485 Mockingbird Ln
- 4472 Mockingbird Ln
- 2260 Ternest Rd
- 4462 Wren Ave
- 4438 Wren Ave
- 4484 Wren Ave
- 4509 Mockingbird Ln
- 2437 Cardinal Dr
- 4514 Mockingbird Ln
- 4523 Mockingbird Ln
- 2430 Cardinal Rd
- 2430 Cardinal Dr
- 4500 Harkleroad Ln
- 2445 Ternest Rd
- 4520 Bluebird Cir
- 4538 Mockingbird Ln
- 4540 Bluebird Cir
- 2433 Sparrow Dr
- 4517 Bluebird Cir
- 4553 Mockingbird Ln