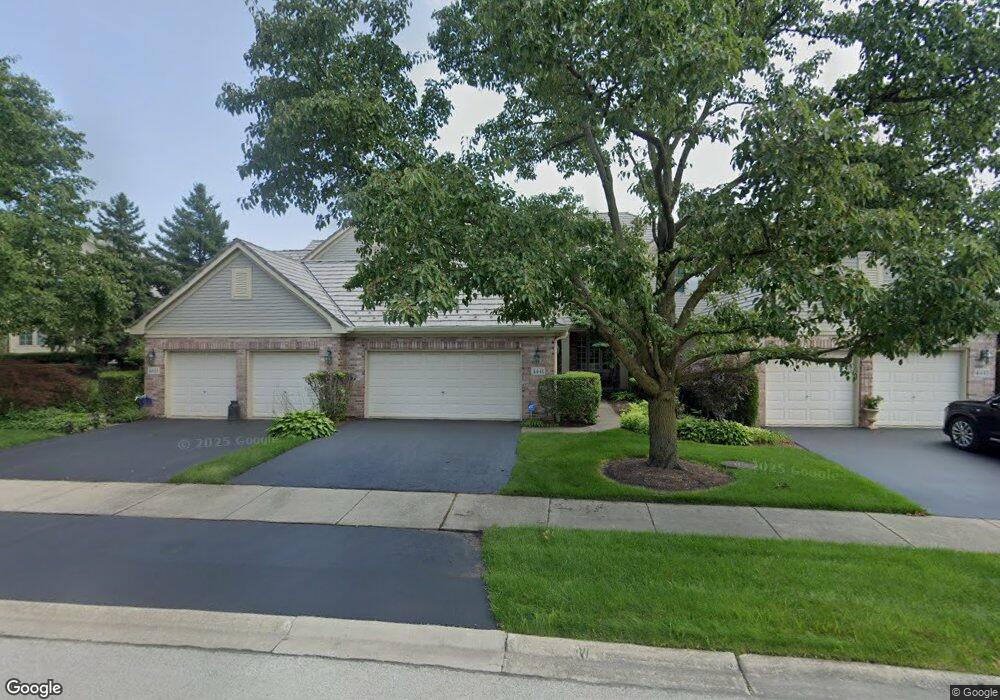
4441 N Seminole Dr Glenview, IL 60026
Estimated Value: $579,695 - $727,000
2
Beds
3
Baths
1,872
Sq Ft
$358/Sq Ft
Est. Value
About This Home
This home is located at 4441 N Seminole Dr, Glenview, IL 60026 and is currently estimated at $670,174, approximately $357 per square foot. 4441 N Seminole Dr is a home located in Cook County with nearby schools including Henry Winkelman Elementary School, Field Middle School, and Glenbrook South High School.
Ownership History
Date
Name
Owned For
Owner Type
Purchase Details
Closed on
Mar 9, 2011
Sold by
Biller Gerald Lawrence
Bought by
Mavrolas Cathy M and Cathy M Mavrolas Trust
Current Estimated Value
Home Financials for this Owner
Home Financials are based on the most recent Mortgage that was taken out on this home.
Original Mortgage
$339,750
Outstanding Balance
$232,433
Interest Rate
4.93%
Mortgage Type
New Conventional
Estimated Equity
$437,741
Purchase Details
Closed on
Feb 4, 2000
Sold by
Biller Gerald L
Bought by
Biller Gerald Lawrence and Gerald Lawrence Biller Trust
Purchase Details
Closed on
Nov 7, 1997
Sold by
Willow Venture
Bought by
Biller Gerald L
Home Financials for this Owner
Home Financials are based on the most recent Mortgage that was taken out on this home.
Original Mortgage
$285,250
Interest Rate
7.43%
Create a Home Valuation Report for This Property
The Home Valuation Report is an in-depth analysis detailing your home's value as well as a comparison with similar homes in the area
Home Values in the Area
Average Home Value in this Area
Purchase History
| Date | Buyer | Sale Price | Title Company |
|---|---|---|---|
| Mavrolas Cathy M | $377,500 | Chicago Title Insurance Co | |
| Biller Gerald Lawrence | -- | -- | |
| Biller Gerald L | $357,000 | -- |
Source: Public Records
Mortgage History
| Date | Status | Borrower | Loan Amount |
|---|---|---|---|
| Open | Mavrolas Cathy M | $339,750 | |
| Previous Owner | Biller Gerald L | $285,250 |
Source: Public Records
Tax History
| Year | Tax Paid | Tax Assessment Tax Assessment Total Assessment is a certain percentage of the fair market value that is determined by local assessors to be the total taxable value of land and additions on the property. | Land | Improvement |
|---|---|---|---|---|
| 2025 | $9,327 | $55,001 | $8,143 | $46,858 |
| 2024 | $9,327 | $49,000 | $10,000 | $39,000 |
| 2023 | $9,233 | $49,000 | $10,000 | $39,000 |
| 2022 | $9,233 | $49,000 | $10,000 | $39,000 |
| 2021 | $7,219 | $34,885 | $5,211 | $29,674 |
| 2020 | $6,981 | $34,885 | $5,211 | $29,674 |
| 2019 | $6,771 | $38,336 | $5,211 | $33,125 |
| 2018 | $8,686 | $43,823 | $4,559 | $39,264 |
| 2017 | $8,461 | $43,823 | $4,559 | $39,264 |
| 2016 | $8,809 | $43,823 | $4,559 | $39,264 |
| 2015 | $8,470 | $38,584 | $3,745 | $34,839 |
| 2014 | $8,249 | $38,584 | $3,745 | $34,839 |
| 2013 | $8,061 | $38,584 | $3,745 | $34,839 |
Source: Public Records
Map
Nearby Homes
- 2501 Indian Ridge Dr
- 2803 Wildflower Ct
- 3240 Brookdale Ln
- 2410 White Oak Dr
- 2390 White Oak Dr
- 3282 Doriann Dr
- 3293 Doriann Dr
- 2308 Indian Ridge Dr
- 3005 Highland Rd
- 3190 Landwehr Rd
- 4142 Hampton Ct
- 3246 Landwehr Rd Unit 3
- 2432 Auburn Ln
- 4408 Hammersmith Ln
- 2149 Post Rd
- 3806 Michael Ln
- 3250 Sanders Rd Unit 10C
- 3856 S Parkway Dr Unit 3B
- 3800 Kiess Dr
- 3266 Sanders Rd Unit 6F
- 4437 S Seminole Dr
- 4445 N Seminole Dr
- 4433 N Seminole Dr
- 4429 N Seminole Dr
- 4511 N Seminole Dr
- 4510 N Seminole Dr
- 4506 N Seminole Dr
- 4425 N Seminole Dr
- 4515 N Seminole Dr
- 4514 N Seminole Dr
- 2806 Pawnee Cir
- 4519 S Seminole Dr
- 4518 N Seminole Dr
- 4421 N Seminole Dr
- 2810 Pawnee Cir
- 4417 N Seminole Dr
- 4522 N Seminole Dr
- 4413 N Seminole Dr
- 4436 S Seminole Dr
- 4440 S Seminole Dr
Your Personal Tour Guide
Ask me questions while you tour the home.