Estimated Value: $433,000 - $471,000
5
Beds
2
Baths
1,920
Sq Ft
$234/Sq Ft
Est. Value
About This Home
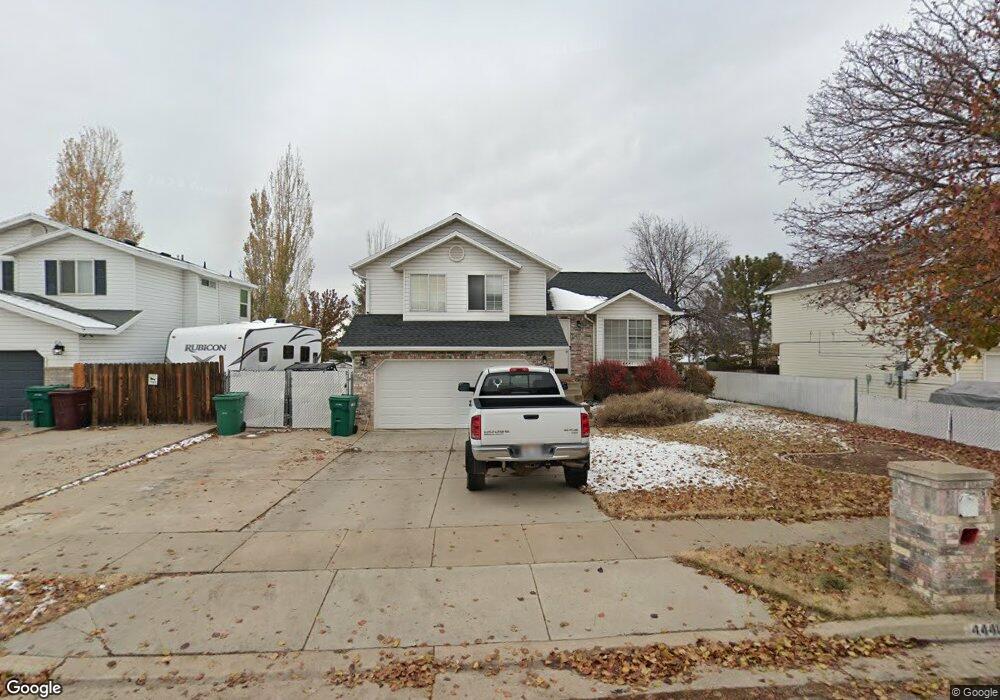
This home is located at 4441 S 2750 W, Roy, UT 84067 and is currently estimated at $448,573, approximately $233 per square foot. 4441 S 2750 W is a home located in Weber County with nearby schools including Midland School, Sand Ridge Junior High School, and Roy High School.
Ownership History
Date
Name
Owned For
Owner Type
Purchase Details
Closed on
Jul 9, 2008
Sold by
Mickelson Tanner T and Mickelson Devri
Bought by
Smith Joshua C and Smith Cari L
Current Estimated Value
Home Financials for this Owner
Home Financials are based on the most recent Mortgage that was taken out on this home.
Original Mortgage
$182,040
Outstanding Balance
$117,261
Interest Rate
6.04%
Mortgage Type
FHA
Estimated Equity
$331,312
Purchase Details
Closed on
Oct 29, 2002
Sold by
May Tammy K
Bought by
Mickelson Tanner T and Mickelson Devri
Home Financials for this Owner
Home Financials are based on the most recent Mortgage that was taken out on this home.
Original Mortgage
$122,900
Interest Rate
5.99%
Purchase Details
Closed on
Dec 19, 2000
Sold by
May Ronny Todd
Bought by
May Tammy K
Home Financials for this Owner
Home Financials are based on the most recent Mortgage that was taken out on this home.
Original Mortgage
$116,000
Interest Rate
11.64%
Create a Home Valuation Report for This Property
The Home Valuation Report is an in-depth analysis detailing your home's value as well as a comparison with similar homes in the area
Home Values in the Area
Average Home Value in this Area
Purchase History
| Date | Buyer | Sale Price | Title Company |
|---|---|---|---|
| Smith Joshua C | -- | First American Builder Svc | |
| Mickelson Tanner T | -- | Bonneville Title | |
| May Tammy K | -- | Backman Stewart Title |
Source: Public Records
Mortgage History
| Date | Status | Borrower | Loan Amount |
|---|---|---|---|
| Open | Smith Joshua C | $182,040 | |
| Previous Owner | Mickelson Tanner T | $122,900 | |
| Previous Owner | May Tammy K | $116,000 |
Source: Public Records
Tax History Compared to Growth
Tax History
| Year | Tax Paid | Tax Assessment Tax Assessment Total Assessment is a certain percentage of the fair market value that is determined by local assessors to be the total taxable value of land and additions on the property. | Land | Improvement |
|---|---|---|---|---|
| 2025 | $2,606 | $412,947 | $128,127 | $284,820 |
| 2024 | $2,544 | $223,299 | $70,469 | $152,830 |
| 2023 | $2,284 | $199,100 | $70,834 | $128,266 |
| 2022 | $2,352 | $211,750 | $60,038 | $151,712 |
| 2021 | $2,034 | $302,000 | $74,159 | $227,841 |
| 2020 | $1,894 | $258,000 | $74,159 | $183,841 |
| 2019 | $1,841 | $236,000 | $44,301 | $191,699 |
| 2018 | $1,744 | $210,000 | $44,301 | $165,699 |
| 2017 | $1,706 | $193,000 | $42,356 | $150,644 |
| 2016 | $1,564 | $94,493 | $24,520 | $69,973 |
| 2015 | $1,400 | $85,984 | $24,520 | $61,464 |
| 2014 | $1,363 | $82,500 | $24,520 | $57,980 |
Source: Public Records
Map
Nearby Homes
- 2816 W 4400 S
- 4553 Trailside Dr
- 2802 W 4375 S
- 2642 W 4400 S
- 4635 S 2950 W
- 2835 W 4200 S
- 2979 W 4275 S
- 2777 W 4175 S Unit 229
- 1952 W 5450 S
- 3084 W 4375 S
- 3014 W 4750 S
- 2778 W 4175 S Unit 235
- 4670 S 2525 W
- 4118 Westlake Dr
- 4875 S 2675 W
- 3046 W 4850 S
- 4891 S 2875 W
- 4022 S 2725 W
- 3171 W 4725 S
- 4919 S 2675 W