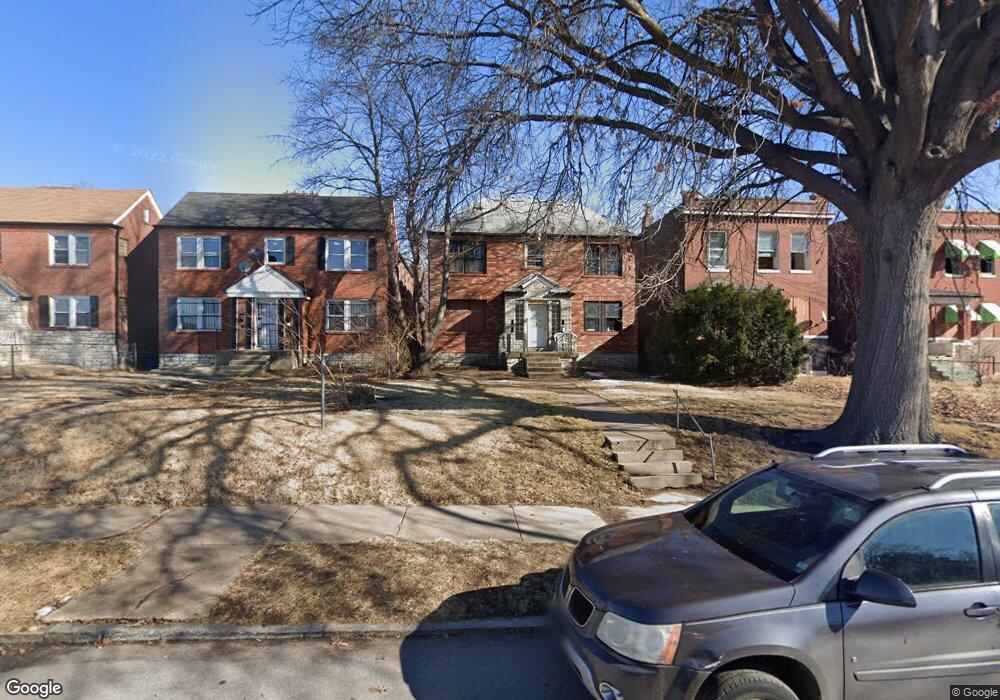
4441 San Francisco Ave Saint Louis, MO 63115
Penrose NeighborhoodEstimated Value: $75,000 - $103,000
--
Bed
4
Baths
3,168
Sq Ft
$29/Sq Ft
Est. Value
About This Home
This home is located at 4441 San Francisco Ave, Saint Louis, MO 63115 and is currently estimated at $91,333, approximately $28 per square foot. 4441 San Francisco Ave is a home located in St. Louis City with nearby schools including Ashland Elementary School, Yeatman-Liddell Middle School, and Vashon High School.
Ownership History
Date
Name
Owned For
Owner Type
Purchase Details
Closed on
Sep 4, 2019
Sold by
City Of St Louis
Bought by
Ransom Terrence
Current Estimated Value
Purchase Details
Closed on
Mar 20, 2015
Sold by
Olp Holding Llc
Bought by
Qunitero Victor D
Purchase Details
Closed on
Aug 27, 2012
Sold by
City Of St Louis
Bought by
Olp Holdings Llc
Purchase Details
Closed on
Jul 15, 2002
Sold by
Wooten Jermaine
Bought by
Lares Oscar
Home Financials for this Owner
Home Financials are based on the most recent Mortgage that was taken out on this home.
Original Mortgage
$94,400
Interest Rate
6.73%
Mortgage Type
Purchase Money Mortgage
Purchase Details
Closed on
Feb 21, 2002
Sold by
Wells Fargo Bank Minnesota Na
Bought by
Wooten Jermaine
Purchase Details
Closed on
Nov 8, 2001
Sold by
West Willie
Bought by
Wells Fargo Bank Minnesota Na
Create a Home Valuation Report for This Property
The Home Valuation Report is an in-depth analysis detailing your home's value as well as a comparison with similar homes in the area
Home Values in the Area
Average Home Value in this Area
Purchase History
| Date | Buyer | Sale Price | Title Company |
|---|---|---|---|
| Ransom Terrence | $4,900 | None Available | |
| Qunitero Victor D | -- | None Available | |
| Olp Holdings Llc | $6,500 | None Available | |
| Lares Oscar | -- | -- | |
| Wooten Jermaine | -- | -- | |
| Wells Fargo Bank Minnesota Na | $41,562 | -- |
Source: Public Records
Mortgage History
| Date | Status | Borrower | Loan Amount |
|---|---|---|---|
| Previous Owner | Lares Oscar | $94,400 |
Source: Public Records
Tax History Compared to Growth
Tax History
| Year | Tax Paid | Tax Assessment Tax Assessment Total Assessment is a certain percentage of the fair market value that is determined by local assessors to be the total taxable value of land and additions on the property. | Land | Improvement |
|---|---|---|---|---|
| 2025 | $456 | $5,300 | $380 | $4,920 |
| 2024 | $443 | $5,110 | $380 | $4,730 |
| 2023 | $443 | $5,110 | $380 | $4,730 |
| 2022 | $443 | $5,020 | $380 | $4,640 |
| 2021 | $442 | $5,020 | $380 | $4,640 |
| 2020 | $439 | $5,020 | $380 | $4,640 |
| 2019 | $438 | $5,020 | $380 | $4,640 |
| 2018 | $446 | $4,960 | $380 | $4,580 |
| 2017 | $438 | $4,960 | $380 | $4,580 |
| 2016 | $485 | $5,450 | $760 | $4,690 |
| 2015 | $442 | $5,450 | $760 | $4,690 |
| 2014 | $438 | $5,450 | $760 | $4,690 |
| 2013 | -- | $5,400 | $760 | $4,640 |
Source: Public Records
Map
Nearby Homes
- 3003 TAYOR N Taylor Ave
- 4416 San Francisco Ave
- 4534 Margaretta Ave
- 4538 San Francisco Ave
- 3624 N Taylor Ave
- 4429 Farlin Ave
- 3526 Paris Ave
- 4236 W Sacramento Ave
- 4629 Farlin Ave
- 4499 Lee Ave Unit B
- 4607 Lee Ave
- 3209 N Taylor Ave
- 4414 Elmbank Ave
- 4655 Lee Ave
- 4477 Bessie Ave
- 4681 Kossuth Ave
- 4713-4715 Natural Bridge Ave
- 4707 Farlin Ave
- 4246 N Taylor Ave
- 4239 E Margaretta Ave
- 4439 San Francisco Ave
- 4445 San Francisco Ave
- 4435 San Francisco Ave
- 4449 San Francisco Ave
- 4453 San Francisco Ave
- 4457 San Francisco Ave
- 4461 San Francisco Ave
- 4463 San Francisco Ave
- 4434 Margaretta Ave
- 4438 Margaretta Ave
- 4442 Margaretta Ave
- 4446 San Francisco Ave
- 4442 San Francisco Ave
- 4446 Margaretta Ave
- 4452 San Francisco Ave
- 4436 San Francisco Ave
- 4454 San Francisco Ave
- 4467 San Francisco Ave
- 4430 San Francisco Ave
- 4456 San Francisco Ave