Estimated Value: $308,063 - $332,000
3
Beds
3
Baths
2,210
Sq Ft
$144/Sq Ft
Est. Value
About This Home
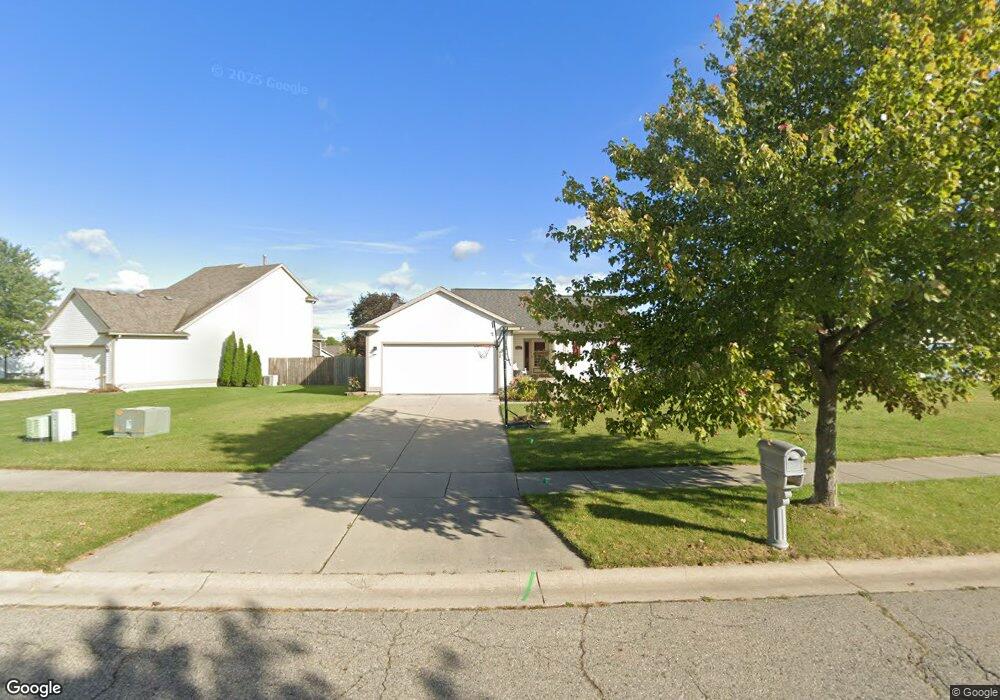
This home is located at 4444 Gateway Dr Unit 43, Holt, MI 48842 and is currently estimated at $317,766, approximately $143 per square foot. 4444 Gateway Dr Unit 43 is a home located in Ingham County with nearby schools including Mason High School and Central Lutheran High School.
Ownership History
Date
Name
Owned For
Owner Type
Purchase Details
Closed on
Jul 15, 2022
Sold by
Lynn Tjarks Candyce
Bought by
Tjarks Joel E
Current Estimated Value
Home Financials for this Owner
Home Financials are based on the most recent Mortgage that was taken out on this home.
Original Mortgage
$225,000
Outstanding Balance
$215,285
Interest Rate
5.78%
Mortgage Type
New Conventional
Estimated Equity
$102,481
Purchase Details
Closed on
Jul 25, 2008
Sold by
Nielsen Patrick R and Nielsen Darlene A
Bought by
Tjarks Joel E
Home Financials for this Owner
Home Financials are based on the most recent Mortgage that was taken out on this home.
Original Mortgage
$135,903
Interest Rate
6.39%
Mortgage Type
FHA
Purchase Details
Closed on
Sep 15, 1998
Bought by
Nielsen Patrick and Nielsen Darlene
Create a Home Valuation Report for This Property
The Home Valuation Report is an in-depth analysis detailing your home's value as well as a comparison with similar homes in the area
Home Values in the Area
Average Home Value in this Area
Purchase History
| Date | Buyer | Sale Price | Title Company |
|---|---|---|---|
| Tjarks Joel E | -- | None Listed On Document | |
| Tjarks Joel E | $138,000 | Atlantic Pacific Title Agenc | |
| Nielsen Patrick | $124,600 | -- |
Source: Public Records
Mortgage History
| Date | Status | Borrower | Loan Amount |
|---|---|---|---|
| Open | Tjarks Joel E | $225,000 | |
| Previous Owner | Tjarks Joel E | $135,903 |
Source: Public Records
Tax History Compared to Growth
Tax History
| Year | Tax Paid | Tax Assessment Tax Assessment Total Assessment is a certain percentage of the fair market value that is determined by local assessors to be the total taxable value of land and additions on the property. | Land | Improvement |
|---|---|---|---|---|
| 2025 | $4,468 | $146,200 | $42,000 | $104,200 |
| 2024 | $11 | $137,400 | $38,200 | $99,200 |
| 2023 | $4,165 | $120,200 | $30,600 | $89,600 |
| 2022 | $3,971 | $102,400 | $22,900 | $79,500 |
| 2021 | $3,912 | $96,200 | $17,200 | $79,000 |
| 2020 | $3,859 | $94,500 | $17,200 | $77,300 |
| 2019 | $3,690 | $90,300 | $13,900 | $76,400 |
| 2018 | $3,668 | $87,200 | $13,900 | $73,300 |
| 2017 | $3,206 | $87,200 | $13,900 | $73,300 |
| 2016 | $3,177 | $85,300 | $16,500 | $68,800 |
| 2015 | $3,219 | $85,100 | $33,000 | $52,100 |
| 2014 | $3,219 | $80,900 | $33,000 | $47,900 |
Source: Public Records
Map
Nearby Homes
- 1198 Wildflower Dr
- 4535 Garden Gate Unit 21
- 4535 Harper Rd
- 1535 Thimbleberry Dr
- 1566 Berkley Dr
- 1596 Berkley Dr
- 4786 Harper Rd
- 4344 Willesdon Ave
- 0 Aurelius Rd Unit 282659
- 1532 N Eifert Rd
- 1942 Walnut St
- 1947 Maple St
- 1812 Tupelo Trail
- 4261 Holt Rd
- 4592 Holt Rd
- 5071 Haddon Hall Dr
- 4245 Holt Rd
- 1511 Antler Cir
- 4198 Greenwood Ave
- 4282 Woodworth Ave
- 4436 Gateway Dr
- 4452 Gateway Dr Unit 42
- 1332 Hosta Ct Unit 53
- 1301 Yarrow Dr
- 4460 Gateway Dr Unit 41
- 1327 Hosta Ct Unit 52
- 1282 Sumac Ln
- 1336 Hosta Ct Unit 54
- 1309 Yarrow Dr
- 1285 Wildflower Dr
- 1285 Sumac Ln Unit 23
- 1296 Daylilly Dr Unit 22
- 1331 Hosta Ct Unit 51
- 1274 Sumac Ln
- 1340 Hosta Ct
- 1306 Daylilly Dr Unit 21
- 1315 Yarrow Dr
- 1279 Wildflower Dr
- 1277 Sumac Ln Unit 24
- 1316 Daylilly Dr Unit 20