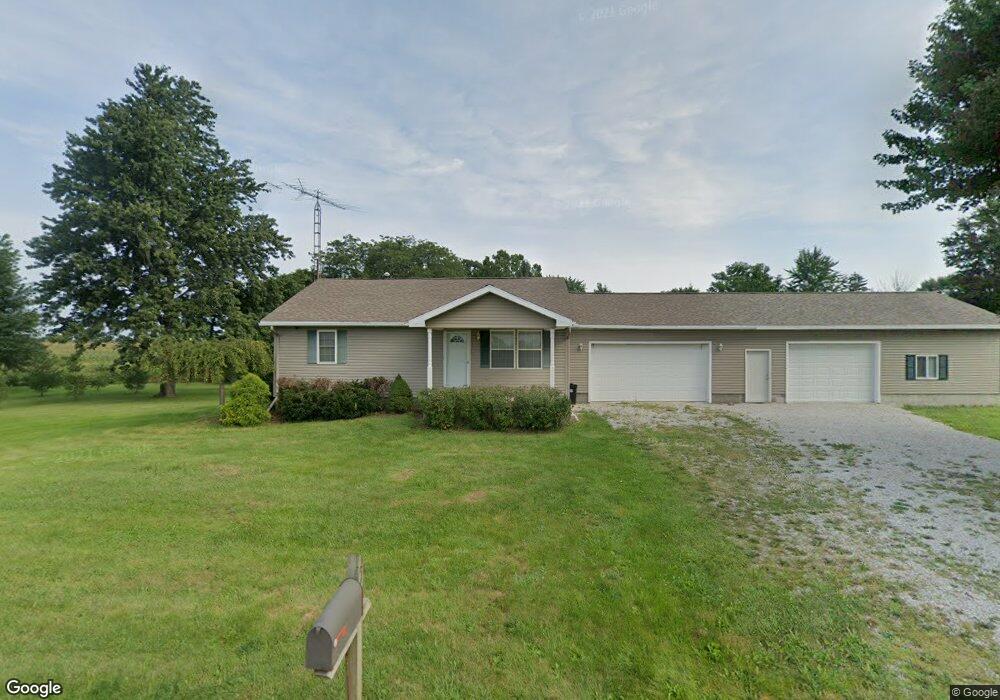
4446 Morral Kirkpatrick Rd E Marion, OH 43302
Estimated Value: $161,013 - $226,000
2
Beds
1
Bath
1,120
Sq Ft
$185/Sq Ft
Est. Value
About This Home
This home is located at 4446 Morral Kirkpatrick Rd E, Marion, OH 43302 and is currently estimated at $207,003, approximately $184 per square foot. 4446 Morral Kirkpatrick Rd E is a home located in Marion County with nearby schools including Ridgedale Elementary School and Ridgedale Junior/Senior High School.
Ownership History
Date
Name
Owned For
Owner Type
Purchase Details
Closed on
Aug 15, 2014
Sold by
Shumaker Brian A
Bought by
Shumaker Jamie L
Current Estimated Value
Home Financials for this Owner
Home Financials are based on the most recent Mortgage that was taken out on this home.
Original Mortgage
$98,135
Outstanding Balance
$74,035
Interest Rate
4.14%
Mortgage Type
VA
Estimated Equity
$132,968
Purchase Details
Closed on
Jan 27, 2012
Sold by
Shumaker Jason and Shumaker Lisa M
Bought by
Shumaker Brian A
Purchase Details
Closed on
Mar 24, 2006
Sold by
Sullivan Kirk
Bought by
Shumaker Jason
Home Financials for this Owner
Home Financials are based on the most recent Mortgage that was taken out on this home.
Original Mortgage
$40,120
Interest Rate
7.6%
Mortgage Type
Adjustable Rate Mortgage/ARM
Create a Home Valuation Report for This Property
The Home Valuation Report is an in-depth analysis detailing your home's value as well as a comparison with similar homes in the area
Purchase History
| Date | Buyer | Sale Price | Title Company |
|---|---|---|---|
| Shumaker Jamie L | $95,000 | American Mid Ohio Title | |
| Shumaker Brian A | $92,000 | Chicago Title | |
| Shumaker Jason | $55,200 | Chelsea Title Agency |
Source: Public Records
Mortgage History
| Date | Status | Borrower | Loan Amount |
|---|---|---|---|
| Open | Shumaker Jamie L | $98,135 | |
| Previous Owner | Shumaker Jason | $40,120 |
Source: Public Records
Tax History
| Year | Tax Paid | Tax Assessment Tax Assessment Total Assessment is a certain percentage of the fair market value that is determined by local assessors to be the total taxable value of land and additions on the property. | Land | Improvement |
|---|---|---|---|---|
| 2025 | $1,610 | $40,690 | $7,510 | $33,180 |
| 2024 | $1,610 | $38,350 | $6,880 | $31,470 |
| 2023 | $1,610 | $38,350 | $6,880 | $31,470 |
| 2022 | $1,507 | $38,350 | $6,880 | $31,470 |
| 2021 | $1,327 | $30,580 | $5,990 | $24,590 |
| 2020 | $1,279 | $30,580 | $5,990 | $24,590 |
| 2019 | $1,176 | $28,170 | $5,990 | $22,180 |
| 2018 | $975 | $24,950 | $6,710 | $18,240 |
| 2017 | $955 | $24,950 | $6,710 | $18,240 |
| 2016 | $910 | $24,950 | $6,710 | $18,240 |
| 2015 | $893 | $23,890 | $5,990 | $17,900 |
| 2014 | $896 | $23,890 | $5,990 | $17,900 |
| 2012 | $774 | $19,360 | $7,380 | $11,980 |
Source: Public Records
Map
Nearby Homes
- 0 Linn-Hipsher Rd
- 5140 Caledonia Mud Pike
- 327 N High St
- 316 N Main St
- 210 S Elm St
- 36 West St
- 2515 Mercer Dr
- 1767 Harding Hwy E
- 0 Pole Lane Rd Unit 226000425
- 3899 Marion-Williamsport Rd E
- 3953 Marion-Bucyrus Rd
- 714 Poe Rd
- 2946 Martel Rd
- 0 Whetstone River Rd N
- 815 Irvin-Shoots Rd E
- 800 Township Highway 68
- 0 Township Road 65
- 0 Wedgewood
- 1580 Marion Rd
- 1540 Rosedale Ave
- 4420 Morral Kirkpatrick Rd E
- 4420 Morral Kirkpatrick Rd E
- 5019 Columbus Sandusky Rd N
- 5033 Columbus Sandusky Rd N
- 5045 Columbus Sandusky Rd N
- 5053 Columbus Sandusky Rd N
- 5063 Columbus Sandusky Rd N
- 5000 Columbus Sandusky Rd N
- 5073 Columbus Sandusky Rd N
- 5073 Columbus Sandusky Rd N
- 4978 Columbus Sandusky Rd N
- 5046 Columbus Sandusky Rd N
- 5085 Columbus Sandusky Rd N
- 5093 Columbus Sandusky Rd N
- 4531 Morral Kirkpatrick Rd E
- 4950 Columbus Sandusky Rd N
- 5111 Columbus Sandusky Rd N
- 5108 Columbus Sandusky Rd N
- 4902 Columbus-Sandusky Rd N
- 5128 Columbus Sandusky Rd N
Your Personal Tour Guide
Ask me questions while you tour the home.