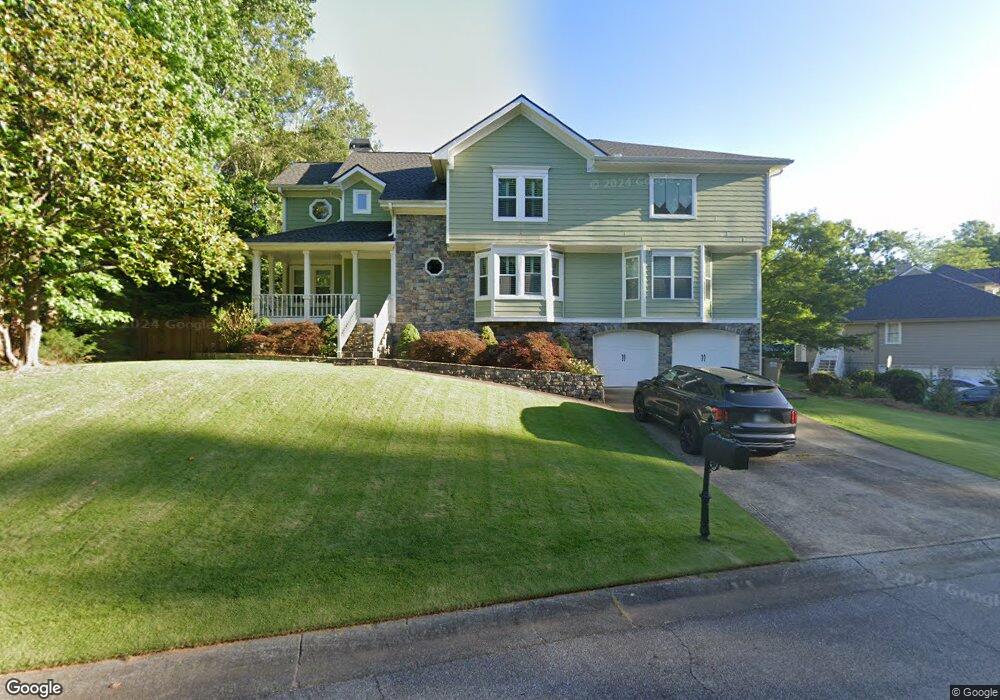
4448 Coventry Ct NE Roswell, GA 30075
East Cobb NeighborhoodEstimated Value: $506,000 - $546,000
3
Beds
3
Baths
2,000
Sq Ft
$264/Sq Ft
Est. Value
About This Home
This home is located at 4448 Coventry Ct NE, Roswell, GA 30075 and is currently estimated at $528,816, approximately $264 per square foot. 4448 Coventry Ct NE is a home located in Cobb County with nearby schools including Garrison Mill Elementary School, Mabry Middle School, and Lassiter High School.
Ownership History
Date
Name
Owned For
Owner Type
Purchase Details
Closed on
Mar 29, 2006
Sold by
Merck Melinda D
Bought by
Honican Alice M and Honican Ryan
Current Estimated Value
Home Financials for this Owner
Home Financials are based on the most recent Mortgage that was taken out on this home.
Original Mortgage
$226,500
Outstanding Balance
$128,462
Interest Rate
6.23%
Mortgage Type
New Conventional
Estimated Equity
$400,354
Purchase Details
Closed on
Oct 25, 2002
Sold by
Farra Shawn M
Bought by
Gatch Melinda D
Home Financials for this Owner
Home Financials are based on the most recent Mortgage that was taken out on this home.
Original Mortgage
$184,350
Interest Rate
5.88%
Mortgage Type
New Conventional
Purchase Details
Closed on
Oct 23, 1998
Sold by
Farra Shaw M
Bought by
Farra Shawn M and Farra L Heureux G
Home Financials for this Owner
Home Financials are based on the most recent Mortgage that was taken out on this home.
Original Mortgage
$137,650
Interest Rate
6.61%
Mortgage Type
VA
Create a Home Valuation Report for This Property
The Home Valuation Report is an in-depth analysis detailing your home's value as well as a comparison with similar homes in the area
Home Values in the Area
Average Home Value in this Area
Purchase History
| Date | Buyer | Sale Price | Title Company |
|---|---|---|---|
| Honican Alice M | $226,500 | -- | |
| Gatch Melinda D | $179,000 | -- | |
| Farra Shawn M | -- | -- | |
| Farra Shawn M | $134,000 | -- |
Source: Public Records
Mortgage History
| Date | Status | Borrower | Loan Amount |
|---|---|---|---|
| Open | Honican Alice M | $226,500 | |
| Previous Owner | Gatch Melinda D | $184,350 | |
| Previous Owner | Farra Shawn M | $137,650 |
Source: Public Records
Tax History Compared to Growth
Tax History
| Year | Tax Paid | Tax Assessment Tax Assessment Total Assessment is a certain percentage of the fair market value that is determined by local assessors to be the total taxable value of land and additions on the property. | Land | Improvement |
|---|---|---|---|---|
| 2025 | $4,455 | $189,708 | $52,000 | $137,708 |
| 2024 | $4,224 | $178,848 | $40,400 | $138,448 |
| 2023 | $3,681 | $178,848 | $40,400 | $138,448 |
| 2022 | $3,602 | $148,924 | $35,200 | $113,724 |
| 2021 | $3,118 | $126,792 | $33,200 | $93,592 |
| 2020 | $3,118 | $126,792 | $33,200 | $93,592 |
| 2019 | $3,021 | $122,344 | $33,200 | $89,144 |
| 2018 | $2,560 | $101,296 | $22,000 | $79,296 |
| 2017 | $2,463 | $101,296 | $22,000 | $79,296 |
| 2016 | $2,005 | $80,380 | $22,000 | $58,380 |
| 2015 | $2,054 | $80,380 | $22,000 | $58,380 |
| 2014 | $1,763 | $68,188 | $0 | $0 |
Source: Public Records
Map
Nearby Homes
- 4300 Inverness Ct NE Unit 1
- 3985 Loch Highland Pass NE
- 3865 Mabry Rd NE
- 4209 Loch Highland Pkwy NE
- 4363 Old Mabry Rd NE
- 4361 Old Mabry Ln NE
- 4520 Huntridge Dr NE
- 4274 Loch Highland Pkwy NE
- 3760 Loch Highland Pkwy NE
- 4509 Bastion Dr
- 4505 Bastion Dr
- 11140 West Rd
- 11180 West Rd
- 3990 Wesley Chapel Rd
- 4022 Wesley Chapel Rd
- 4032 Wesley Chapel Rd
- 11395 West Rd
- 4019 Wesley Chapel Rd
- 4444 Coventry Ct NE
- 4446 Coventry Ct NE
- 4445 Coventry Ct NE
- 4489 Coventry Way NE
- 4447 Coventry Ct NE
- 4493 Coventry Way NE
- 0 Coventry Ct Unit 7314542
- 0 Coventry Ct
- 4442 Coventry Ct NE
- 4443 Coventry Ct NE
- 4497 Coventry Way NE
- 4449 Coventry Ct NE
- 4481 Coventry Way NE
- 4495 Coventry Way NE
- 0 Coventry Way NE
- 4441 Coventry Ct NE
- 4482 Coventry Way NE
- 4480 Coventry Way NE
- 4415 Mabry Ln
- 4499 Coventry Way NE