Estimated Value: $436,000 - $447,000
5
Beds
3
Baths
2,400
Sq Ft
$183/Sq Ft
Est. Value
About This Home
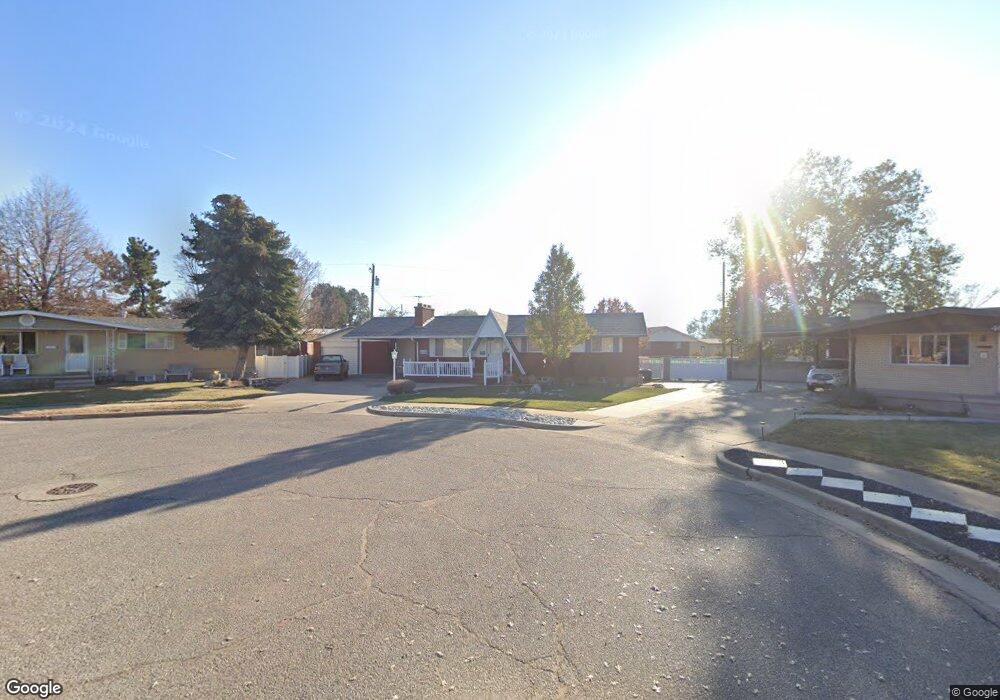
This home is located at 4448 S 2450 W, Roy, UT 84067 and is currently estimated at $439,935, approximately $183 per square foot. 4448 S 2450 W is a home located in Weber County with nearby schools including Valley View School, Sand Ridge Junior High School, and Roy High School.
Ownership History
Date
Name
Owned For
Owner Type
Purchase Details
Closed on
Mar 24, 2009
Sold by
Young Bruce K and Young Karla E
Bought by
Young Bruce K
Current Estimated Value
Home Financials for this Owner
Home Financials are based on the most recent Mortgage that was taken out on this home.
Original Mortgage
$180,526
Outstanding Balance
$114,912
Interest Rate
5.15%
Mortgage Type
FHA
Estimated Equity
$325,023
Purchase Details
Closed on
Oct 28, 2008
Sold by
Young Bruce K
Bought by
Young Bruce K and Young Karla E
Home Financials for this Owner
Home Financials are based on the most recent Mortgage that was taken out on this home.
Original Mortgage
$177,859
Interest Rate
5.77%
Mortgage Type
FHA
Purchase Details
Closed on
Jul 17, 2001
Sold by
Cowles James L and Cowles Susan P
Bought by
Young Bruce K and Young Karla E
Home Financials for this Owner
Home Financials are based on the most recent Mortgage that was taken out on this home.
Original Mortgage
$140,000
Interest Rate
7.21%
Create a Home Valuation Report for This Property
The Home Valuation Report is an in-depth analysis detailing your home's value as well as a comparison with similar homes in the area
Home Values in the Area
Average Home Value in this Area
Purchase History
| Date | Buyer | Sale Price | Title Company |
|---|---|---|---|
| Young Bruce K | -- | Metro National Title | |
| Young Bruce K | -- | Merrill Title Company | |
| Young Bruce K | -- | Merrill Title Company | |
| Young Bruce K | -- | Mountain View Title |
Source: Public Records
Mortgage History
| Date | Status | Borrower | Loan Amount |
|---|---|---|---|
| Open | Young Bruce K | $180,526 | |
| Closed | Young Bruce K | $177,859 | |
| Closed | Young Bruce K | $140,000 | |
| Closed | Young Bruce K | $133,000 |
Source: Public Records
Tax History
| Year | Tax Paid | Tax Assessment Tax Assessment Total Assessment is a certain percentage of the fair market value that is determined by local assessors to be the total taxable value of land and additions on the property. | Land | Improvement |
|---|---|---|---|---|
| 2025 | $550 | $428,458 | $122,630 | $305,828 |
| 2024 | $566 | $231,549 | $67,447 | $164,102 |
| 2023 | $427 | $208,450 | $64,239 | $144,211 |
| 2022 | $1,545 | $244,200 | $55,729 | $188,471 |
| 2021 | $864 | $308,000 | $71,325 | $236,675 |
| 2020 | $589 | $257,000 | $71,325 | $185,675 |
| 2019 | $553 | $245,000 | $40,995 | $204,005 |
| 2018 | $466 | $226,000 | $36,920 | $189,080 |
| 2017 | $228 | $190,000 | $36,920 | $153,080 |
| 2016 | $191 | $97,233 | $19,302 | $77,931 |
| 2015 | $188 | $88,216 | $19,302 | $68,914 |
| 2014 | $186 | $78,699 | $16,433 | $62,266 |
Source: Public Records
Map
Nearby Homes
- 4248 S 2400 W
- 4297 Westlake Dr
- 4328 S 2175 W
- 2815 W 4275 S
- 4881 S 2400 W
- 4732 S West Park Dr
- 4220 S 2075 W
- 2038 W 4600 S
- 4061 S 2175 W
- 2778 W 4175 S Unit 237
- 2015 W 4225 S
- 4047 S 2175 W
- 4374 S 2900 W
- 4270 S 2900 W
- 2953 W 4650 S
- 4642 S 1900 W Unit 41
- 2979 W 4275 S
- 2581 W 5000 S
- 5024 S 2575 W
- 3860 Midland Dr Unit C10
Your Personal Tour Guide
Ask me questions while you tour the home.