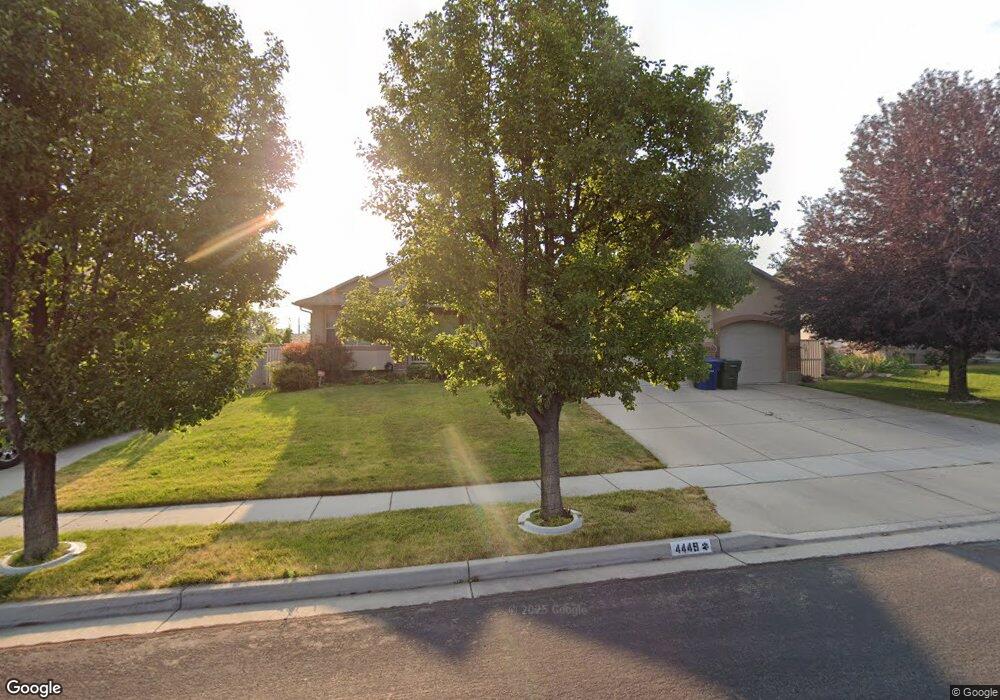
4449 S Maple Meadows Dr Salt Lake City, UT 84120
Granger NeighborhoodEstimated Value: $630,000 - $675,000
3
Beds
3
Baths
1,973
Sq Ft
$333/Sq Ft
Est. Value
About This Home
This home is located at 4449 S Maple Meadows Dr, Salt Lake City, UT 84120 and is currently estimated at $656,936, approximately $332 per square foot. 4449 S Maple Meadows Dr is a home located in Salt Lake County with nearby schools including David Gourley Elementary School, Kennedy Junior High School, and Hunter High School.
Ownership History
Date
Name
Owned For
Owner Type
Purchase Details
Closed on
Jan 10, 2025
Sold by
Glenda White Living Trust and Jakeman Shane
Bought by
Jakeman Dylan Lee
Current Estimated Value
Purchase Details
Closed on
Jun 2, 2021
Sold by
White Glenda Kay
Bought by
White Glenda Kay and Jakeman Dylan Lee
Purchase Details
Closed on
Mar 18, 2021
Sold by
White Thomas Joseph
Bought by
White Glenda Kay
Purchase Details
Closed on
Mar 8, 2021
Sold by
White Glenda Kay
Bought by
White Glenda Kay
Purchase Details
Closed on
Dec 28, 2005
Sold by
Kehl Homes Inc
Bought by
White Thomas J and White Glenda Kay
Home Financials for this Owner
Home Financials are based on the most recent Mortgage that was taken out on this home.
Original Mortgage
$259,330
Interest Rate
6.36%
Mortgage Type
Purchase Money Mortgage
Create a Home Valuation Report for This Property
The Home Valuation Report is an in-depth analysis detailing your home's value as well as a comparison with similar homes in the area
Home Values in the Area
Average Home Value in this Area
Purchase History
| Date | Buyer | Sale Price | Title Company |
|---|---|---|---|
| Jakeman Dylan Lee | -- | None Listed On Document | |
| Jakeman Dylan Lee | -- | None Listed On Document | |
| White Glenda Kay | -- | Eagle Gate Title Ins Agcy | |
| White Glenda Kay | -- | None Listed On Document | |
| White Glenda Kay | -- | None Available | |
| White Thomas J | -- | Merrill Title |
Source: Public Records
Mortgage History
| Date | Status | Borrower | Loan Amount |
|---|---|---|---|
| Previous Owner | White Thomas J | $259,330 |
Source: Public Records
Tax History Compared to Growth
Tax History
| Year | Tax Paid | Tax Assessment Tax Assessment Total Assessment is a certain percentage of the fair market value that is determined by local assessors to be the total taxable value of land and additions on the property. | Land | Improvement |
|---|---|---|---|---|
| 2025 | $4,135 | $640,200 | $93,100 | $547,100 |
| 2024 | $4,135 | $633,500 | $92,500 | $541,000 |
| 2023 | $4,095 | $600,600 | $89,000 | $511,600 |
| 2022 | $3,924 | $577,100 | $87,300 | $489,800 |
| 2021 | $3,483 | $460,400 | $67,100 | $393,300 |
| 2020 | $3,254 | $406,000 | $67,100 | $338,900 |
| 2019 | $3,296 | $396,600 | $63,300 | $333,300 |
| 2018 | $3,113 | $361,000 | $63,300 | $297,700 |
| 2017 | $2,796 | $329,800 | $63,300 | $266,500 |
| 2016 | $2,603 | $307,500 | $63,300 | $244,200 |
| 2015 | $2,377 | $267,400 | $78,300 | $189,100 |
| 2014 | $2,276 | $250,900 | $74,200 | $176,700 |
Source: Public Records
Map
Nearby Homes
- 4216 W 4495 S
- 4332 Losee Dr
- 4125 Benview Dr
- 4516 S 4000 W
- 4112 W 4645 S
- 4621 S Valley Haven Ct
- 4297 S 4580 W
- 4208 S 4205 W
- 4308 S 4580 W
- 4350 S 4665 W
- 4171 S 4205 W
- 4155 W 4715 S
- 4332 S 4665 W
- 4612 S Carnegie Tech St
- 4752 S 4480 W
- 4775 S 4380 W
- 4644 S Carnegie Tech St Unit 4
- 4673 Carnegie Tech St
- 4632 S Arlington Park Dr
- 4784 S 4520 W
- 4459 S Maple Meadows Dr
- 4439 S Maple Meadows Dr
- 4450 S 4280 W
- 4440 S 4280 W
- 4460 S 4280 W
- 4469 S Maple Meadows Dr
- 4429 S Maple Meadows Dr
- 4470 S 4280 W
- 4470 S Maple Meadows Dr
- 4289 Paskay Dr
- 4445 S 4280 W
- 4480 S 4280 W
- 4271 Westlake Ave
- 4346 W Sugar Maple Cir
- 4431 S 4280 W
- 4260 Westlake Ave
- 4489 S Maple Meadows Dr
- 4259 Westlake Ave
- 4335 Sugar Maple Cir
- 4486 S 4280 W