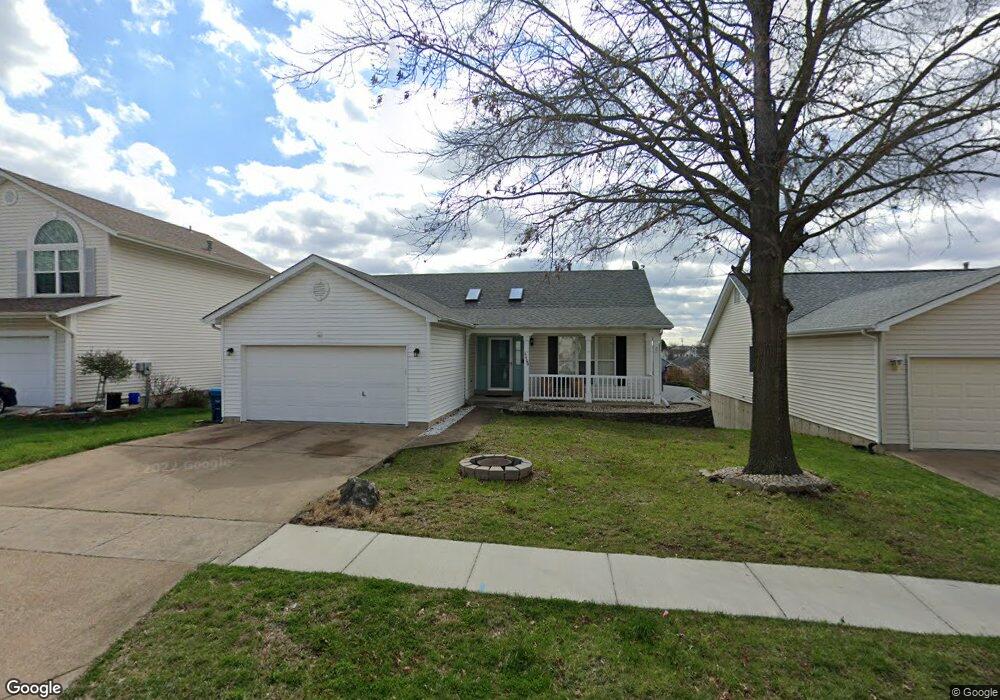
4449 Southview Way Dr Saint Louis, MO 63129
Estimated Value: $285,917 - $334,000
3
Beds
3
Baths
1,248
Sq Ft
$243/Sq Ft
Est. Value
About This Home
This home is located at 4449 Southview Way Dr, Saint Louis, MO 63129 and is currently estimated at $303,729, approximately $243 per square foot. 4449 Southview Way Dr is a home located in St. Louis County with nearby schools including Hagemann Elementary School, Washington Middle School, and Mehlville High School.
Ownership History
Date
Name
Owned For
Owner Type
Purchase Details
Closed on
Jul 7, 2008
Sold by
Beutler Tina M
Bought by
Hang Tung and Hang Amy
Current Estimated Value
Home Financials for this Owner
Home Financials are based on the most recent Mortgage that was taken out on this home.
Original Mortgage
$154,400
Outstanding Balance
$99,810
Interest Rate
6.11%
Mortgage Type
Purchase Money Mortgage
Estimated Equity
$203,919
Purchase Details
Closed on
Nov 10, 2006
Sold by
Beutler Daniel R
Bought by
Beutler Tina M
Home Financials for this Owner
Home Financials are based on the most recent Mortgage that was taken out on this home.
Original Mortgage
$141,900
Interest Rate
6.13%
Mortgage Type
Purchase Money Mortgage
Purchase Details
Closed on
Dec 18, 1998
Sold by
Lee Lawrence M and Lee Barbara E
Bought by
Beutler Daniel R and Beutler Tina M
Home Financials for this Owner
Home Financials are based on the most recent Mortgage that was taken out on this home.
Original Mortgage
$124,925
Interest Rate
6.92%
Create a Home Valuation Report for This Property
The Home Valuation Report is an in-depth analysis detailing your home's value as well as a comparison with similar homes in the area
Home Values in the Area
Average Home Value in this Area
Purchase History
| Date | Buyer | Sale Price | Title Company |
|---|---|---|---|
| Hang Tung | $193,000 | None Available | |
| Beutler Tina M | -- | None Available | |
| Beutler Daniel R | $131,500 | -- |
Source: Public Records
Mortgage History
| Date | Status | Borrower | Loan Amount |
|---|---|---|---|
| Open | Hang Tung | $154,400 | |
| Previous Owner | Beutler Tina M | $141,900 | |
| Previous Owner | Beutler Daniel R | $124,925 |
Source: Public Records
Tax History Compared to Growth
Tax History
| Year | Tax Paid | Tax Assessment Tax Assessment Total Assessment is a certain percentage of the fair market value that is determined by local assessors to be the total taxable value of land and additions on the property. | Land | Improvement |
|---|---|---|---|---|
| 2025 | $2,786 | $48,810 | $14,500 | $34,310 |
| 2024 | $2,786 | $41,370 | $10,870 | $30,500 |
| 2023 | $2,751 | $41,370 | $10,870 | $30,500 |
| 2022 | $2,438 | $36,820 | $9,440 | $27,380 |
| 2021 | $2,360 | $36,820 | $9,440 | $27,380 |
| 2020 | $2,321 | $34,430 | $8,700 | $25,730 |
| 2019 | $2,314 | $34,430 | $8,700 | $25,730 |
| 2018 | $2,491 | $33,500 | $7,260 | $26,240 |
| 2017 | $2,487 | $33,500 | $7,260 | $26,240 |
| 2016 | $2,307 | $29,780 | $7,260 | $22,520 |
| 2015 | $2,118 | $29,780 | $7,260 | $22,520 |
| 2014 | $2,005 | $27,890 | $7,520 | $20,370 |
Source: Public Records
Map
Nearby Homes
- 4357 Bristol View Ct
- 4374 Bristol View Ct
- 5600 Wickershire Ln
- 5524 Providence Place Dr
- 5417 Morningdale Place
- 5942 Hawkins Fuchs Rd
- 4330 Canyonside Ln
- 5968 Southcrest Way
- 4423 Saddleridge Farm Dr
- 4523 Beaver Brook Ct
- 5703 Lilac Trails Dr
- 5251 Tuscan Chase Ct
- 5896 Rockland Ln
- 5827 Bridleford Ln
- 6055 Bayou Bend Ct
- 5714 Shining Day Place
- 5824 Bridleford Ln
- 4305 Grand Marnier Dr
- 4251 Green Grove Ct
- 5408 Medalton Way
- 4445 Southview Way Dr
- 4453 Southview Way Dr
- 5705 Sundesert Cir
- 4441 Southview Way Dr
- 4457 Southview Way Dr
- 5709 Sundesert Cir
- 4437 Southview Way Dr
- 4448 Southview Way Dr
- 4461 Southview Way Dr
- 4444 Southview Way Dr
- 4452 Southview Way Dr
- 5700 Sundesert Cir
- 4440 Southview Way Dr
- 4456 Southview Way Dr
- 5713 Sundesert Cir
- 4465 Southview Way Dr
- 4436 Southview Way Dr
- 4460 Southview Way Dr
- 5704 Sundesert Cir
- 5717 Sundesert Cir