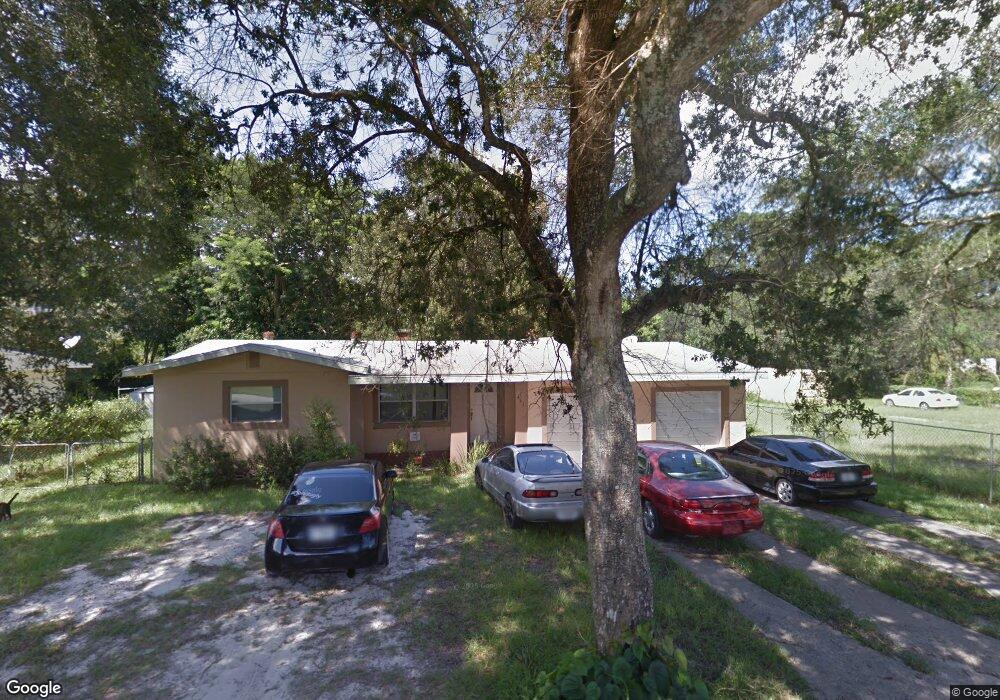
445 E Bennett Ave Deland, FL 32724
North DeLand NeighborhoodEstimated Value: $214,000 - $254,000
3
Beds
2
Baths
2,432
Sq Ft
$95/Sq Ft
Est. Value
About This Home
This home is located at 445 E Bennett Ave, Deland, FL 32724 and is currently estimated at $230,840, approximately $94 per square foot. 445 E Bennett Ave is a home located in Volusia County with nearby schools including George W. Marks Elementary School, Deland High School, and Deland Middle School.
Ownership History
Date
Name
Owned For
Owner Type
Purchase Details
Closed on
Dec 15, 2025
Sold by
Ace Ronald E and Bone Robert E
Bought by
Bengochea Luis Angel
Current Estimated Value
Purchase Details
Closed on
Mar 24, 2020
Sold by
Henry Thomas M and Henry Cheryl L
Bought by
Henry Thomas M and Thomas M Henry Revocable Trust
Purchase Details
Closed on
Jul 10, 2013
Sold by
Henry Thomas M and Henry Cheryl L
Bought by
Henry Thomas M and Henry Cheryl L
Purchase Details
Closed on
Dec 7, 2010
Sold by
Gomillion Francine
Bought by
Henry Thomas M and Henry Cheryl
Purchase Details
Closed on
May 26, 2010
Sold by
Buckner Tony C and Buckner Lisa P
Bought by
Gomillion Francine
Purchase Details
Closed on
Mar 30, 2006
Sold by
Gomillion Aubrey E and Gomillion Francine
Bought by
Buckner Tony C and Buckner Lisa P
Home Financials for this Owner
Home Financials are based on the most recent Mortgage that was taken out on this home.
Original Mortgage
$165,000
Interest Rate
8%
Mortgage Type
Seller Take Back
Create a Home Valuation Report for This Property
The Home Valuation Report is an in-depth analysis detailing your home's value as well as a comparison with similar homes in the area
Home Values in the Area
Average Home Value in this Area
Purchase History
| Date | Buyer | Sale Price | Title Company |
|---|---|---|---|
| Bengochea Luis Angel | $264,000 | Southern Title | |
| Henry Thomas M | $53,090 | Attorney | |
| Henry Thomas M | -- | None Available | |
| Henry Thomas M | $30,000 | City Title Services | |
| Gomillion Francine | $145,000 | Attorney | |
| Buckner Tony C | $175,000 | Volusia Title Services |
Source: Public Records
Mortgage History
| Date | Status | Borrower | Loan Amount |
|---|---|---|---|
| Previous Owner | Buckner Tony C | $165,000 |
Source: Public Records
Tax History
| Year | Tax Paid | Tax Assessment Tax Assessment Total Assessment is a certain percentage of the fair market value that is determined by local assessors to be the total taxable value of land and additions on the property. | Land | Improvement |
|---|---|---|---|---|
| 2026 | $2,530 | $184,552 | $39,375 | $145,177 |
| 2025 | $2,530 | $184,552 | $39,375 | $145,177 |
| 2024 | $2,239 | $189,211 | $39,375 | $149,836 |
| 2023 | $2,239 | $165,691 | $32,288 | $133,403 |
| 2022 | $2,093 | $152,850 | $32,288 | $120,562 |
| 2021 | $2,030 | $134,799 | $22,444 | $112,355 |
| 2020 | $1,869 | $120,842 | $19,688 | $101,154 |
| 2019 | $1,790 | $106,181 | $15,900 | $90,281 |
| 2018 | $1,677 | $96,354 | $10,335 | $86,019 |
| 2017 | $1,564 | $86,217 | $10,290 | $75,927 |
| 2016 | $1,393 | $74,038 | $0 | $0 |
| 2015 | $1,257 | $57,805 | $0 | $0 |
| 2014 | $1,127 | $47,078 | $0 | $0 |
Source: Public Records
Map
Nearby Homes
- 1412 N Garfield Ave
- 516 Grace Ave
- 576 E International Speedway Blvd
- 1301 N Amelia Ave
- 1 Smith Ct
- 1207 N Amelia Ave
- 205 E Kentucky Ave
- 1435 Hensley Dr
- 1367 Hensley Dr
- 106 E Rosehill Ave
- 104 E Rosehill Ave
- 1307 Cook St
- 143 E South St
- 0 North St Unit 1211817
- 0 North St Unit 1216611
- 1215 N Boston Ave
- 0 No Street Name Unit MFRNS1087484
- 0 No St Unit MFRV4933386
- 0 No St Unit MFRO6357154
- 0 No St Unit MFRV4941771
- 443 E Bennett Ave
- 410 E Rosehill Ave
- 451 E Bennett Ave
- 441 E Bennett Ave
- 414 E Rosehill Ave
- 406 E Rosehill Ave
- 410 E Bennett Ave
- 408 E Bennett Ave
- 420 E Bennett Ave
- 420 E Rosehill Ave
- 439 E Bennett Ave
- 406 E Bennett Ave
- 436 E Bennett Ave
- 400 E Rosehill Ave
- 402 E Rosehill Ave
- 1436 N Garfield Ave
- 1434 N Garfield Ave
- 1492 N Garfield Ave
- 1430 N Garfield Ave
- 1498 N Garfield Ave
Your Personal Tour Guide
Ask me questions while you tour the home.