Estimated Value: $391,000 - $495,000
4
Beds
3
Baths
1,684
Sq Ft
$249/Sq Ft
Est. Value
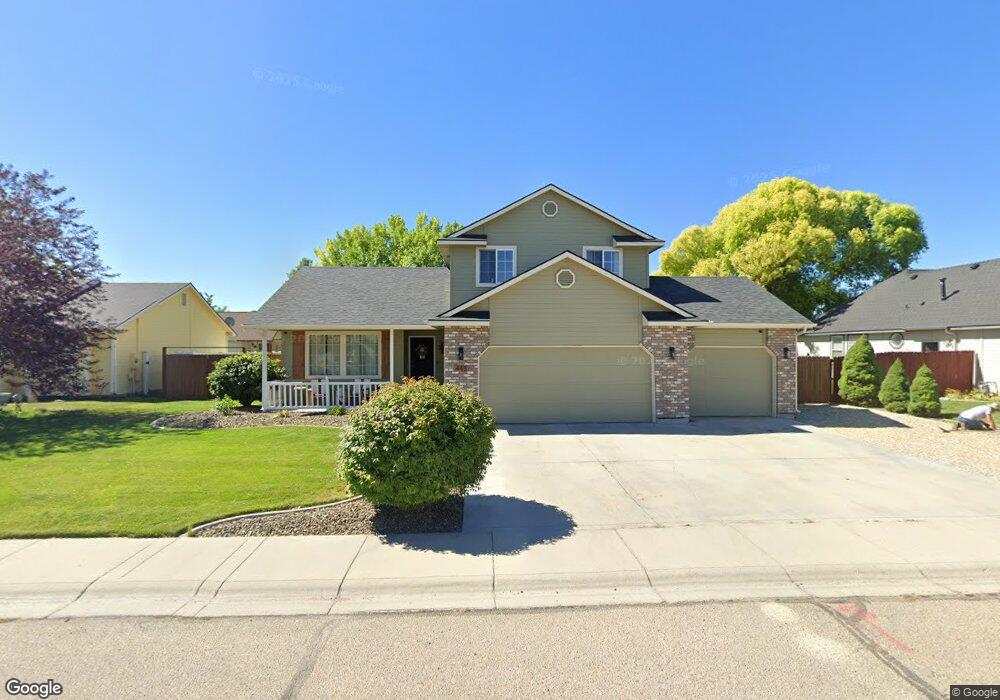
About This Home
This home is located at 445 Fall Dr, Nampa, ID 83686 and is currently estimated at $419,238, approximately $248 per square foot. 445 Fall Dr is a home located in Canyon County with nearby schools including Iowa Elementary School, South Middle School, and Skyview High School.
Ownership History
Date
Name
Owned For
Owner Type
Purchase Details
Closed on
Apr 10, 2023
Sold by
Windmill Properties I Llc
Bought by
Boersma Jeffrey and Boersma Brianna
Current Estimated Value
Home Financials for this Owner
Home Financials are based on the most recent Mortgage that was taken out on this home.
Original Mortgage
$292,000
Outstanding Balance
$283,959
Interest Rate
6.65%
Mortgage Type
New Conventional
Estimated Equity
$135,279
Purchase Details
Closed on
Dec 13, 2021
Sold by
Dejong Simon and Dejong Debra
Bought by
Windmill Properties I Llc
Purchase Details
Closed on
Sep 28, 2005
Sold by
Harrison David L and Harrison Nina V
Bought by
Dejong Simon and Dejong Debra
Home Financials for this Owner
Home Financials are based on the most recent Mortgage that was taken out on this home.
Original Mortgage
$103,660
Interest Rate
5.33%
Mortgage Type
Fannie Mae Freddie Mac
Create a Home Valuation Report for This Property
The Home Valuation Report is an in-depth analysis detailing your home's value as well as a comparison with similar homes in the area
Home Values in the Area
Average Home Value in this Area
Purchase History
| Date | Buyer | Sale Price | Title Company |
|---|---|---|---|
| Boersma Jeffrey | -- | Titleone | |
| Windmill Properties I Llc | -- | None Available | |
| Dejong Simon | -- | Alliance Title & Escrow Corp |
Source: Public Records
Mortgage History
| Date | Status | Borrower | Loan Amount |
|---|---|---|---|
| Open | Boersma Jeffrey | $292,000 | |
| Previous Owner | Dejong Simon | $103,660 |
Source: Public Records
Tax History
| Year | Tax Paid | Tax Assessment Tax Assessment Total Assessment is a certain percentage of the fair market value that is determined by local assessors to be the total taxable value of land and additions on the property. | Land | Improvement |
|---|---|---|---|---|
| 2025 | $1,612 | $382,300 | $98,700 | $283,600 |
| 2024 | $1,612 | $385,300 | $98,700 | $286,600 |
| 2023 | $1,450 | $369,000 | $98,700 | $270,300 |
| 2022 | $2,906 | $393,700 | $111,000 | $282,700 |
| 2021 | $3,400 | $288,600 | $55,500 | $233,100 |
| 2020 | $3,109 | $240,100 | $43,000 | $197,100 |
| 2019 | $3,509 | $218,700 | $37,000 | $181,700 |
| 2018 | $3,432 | $0 | $0 | $0 |
| 2017 | $3,270 | $0 | $0 | $0 |
| 2016 | $3,006 | $0 | $0 | $0 |
| 2015 | $2,594 | $0 | $0 | $0 |
| 2014 | $2,538 | $130,200 | $21,000 | $109,200 |
Source: Public Records
Map
Nearby Homes
- 417 S Valley Dr
- 535 Seasons Ct
- 8094 W Maryland Ave
- 435 Bitterbrush Ave
- 502 Crosspoint Ave
- 514 Crosspoint Ave
- 710 W Wildrye Ct
- 622 W Highland Ave
- 1621 S Woodland Dr
- 2613 S Canyon St
- 1904 Tyler St
- 538 Morning Sun Dr
- 1417 Lois Ln
- 2619 S Sienna Dr
- 2813 S Bayhill Ct
- 2461 S Cordillera Way
- 438 E Elaine Ct
- 435 E Elaine Ct
- 442 E Elaine Ct
- 709 Vista Terrace
Your Personal Tour Guide
Ask me questions while you tour the home.