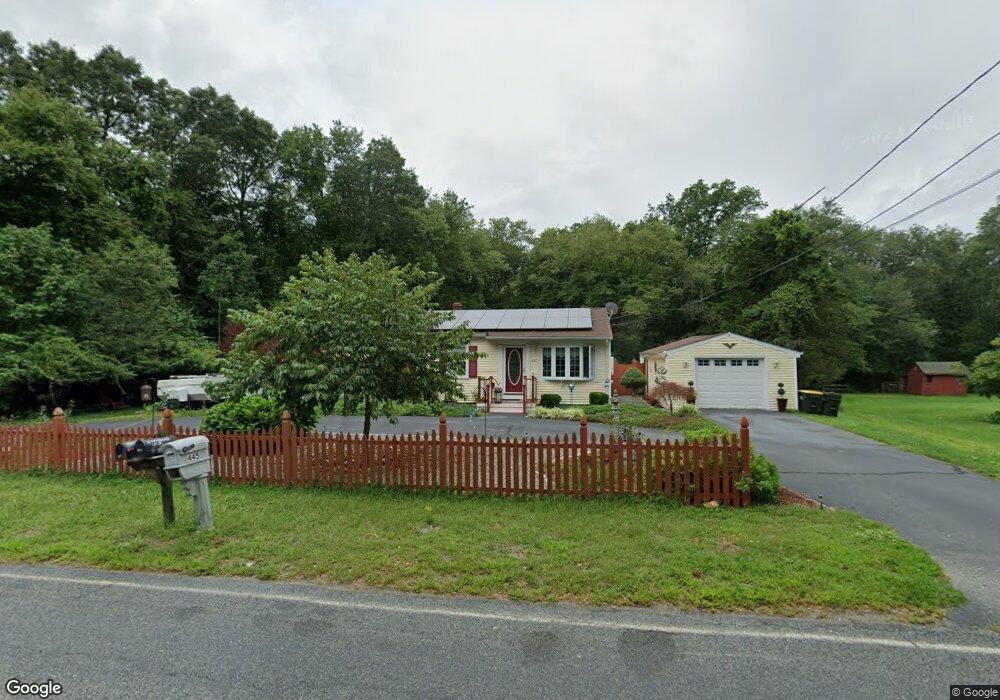
445 Gifford Rd Westport, MA 02790
North Westport NeighborhoodEstimated Value: $440,941 - $503,000
3
Beds
1
Bath
1,025
Sq Ft
$462/Sq Ft
Est. Value
About This Home
This home is located at 445 Gifford Rd, Westport, MA 02790 and is currently estimated at $473,985, approximately $462 per square foot. 445 Gifford Rd is a home located in Bristol County with nearby schools including Alice A. Macomber Primary School, Westport Elementary School, and Westport Middle-High School.
Ownership History
Date
Name
Owned For
Owner Type
Purchase Details
Closed on
Jul 15, 2011
Sold by
Yerid Steven W and Yerid Jennifer A
Bought by
Yerid Steven W
Current Estimated Value
Purchase Details
Closed on
Jun 18, 2008
Sold by
Paulette J Manchester
Bought by
Yerid Jennifer A and Yerid Steven W
Home Financials for this Owner
Home Financials are based on the most recent Mortgage that was taken out on this home.
Original Mortgage
$220,000
Interest Rate
6.1%
Mortgage Type
Purchase Money Mortgage
Create a Home Valuation Report for This Property
The Home Valuation Report is an in-depth analysis detailing your home's value as well as a comparison with similar homes in the area
Home Values in the Area
Average Home Value in this Area
Purchase History
| Date | Buyer | Sale Price | Title Company |
|---|---|---|---|
| Yerid Steven W | -- | -- | |
| Yerid Jennifer A | $220,000 | -- |
Source: Public Records
Mortgage History
| Date | Status | Borrower | Loan Amount |
|---|---|---|---|
| Previous Owner | Yerid Jennifer A | $220,000 |
Source: Public Records
Tax History Compared to Growth
Tax History
| Year | Tax Paid | Tax Assessment Tax Assessment Total Assessment is a certain percentage of the fair market value that is determined by local assessors to be the total taxable value of land and additions on the property. | Land | Improvement |
|---|---|---|---|---|
| 2025 | $2,546 | $341,800 | $169,000 | $172,800 |
| 2024 | $2,480 | $320,800 | $150,100 | $170,700 |
| 2023 | $2,401 | $294,200 | $136,700 | $157,500 |
| 2022 | $2,122 | $271,200 | $136,700 | $134,500 |
| 2021 | $2,122 | $246,200 | $113,000 | $133,200 |
| 2020 | $2,038 | $241,700 | $108,500 | $133,200 |
| 2019 | $1,995 | $241,200 | $108,500 | $132,700 |
| 2018 | $1,871 | $229,000 | $109,700 | $119,300 |
| 2017 | $1,757 | $220,400 | $106,200 | $114,200 |
| 2016 | $1,641 | $207,400 | $102,700 | $104,700 |
| 2015 | $1,582 | $199,500 | $105,000 | $94,500 |
Source: Public Records
Map
Nearby Homes