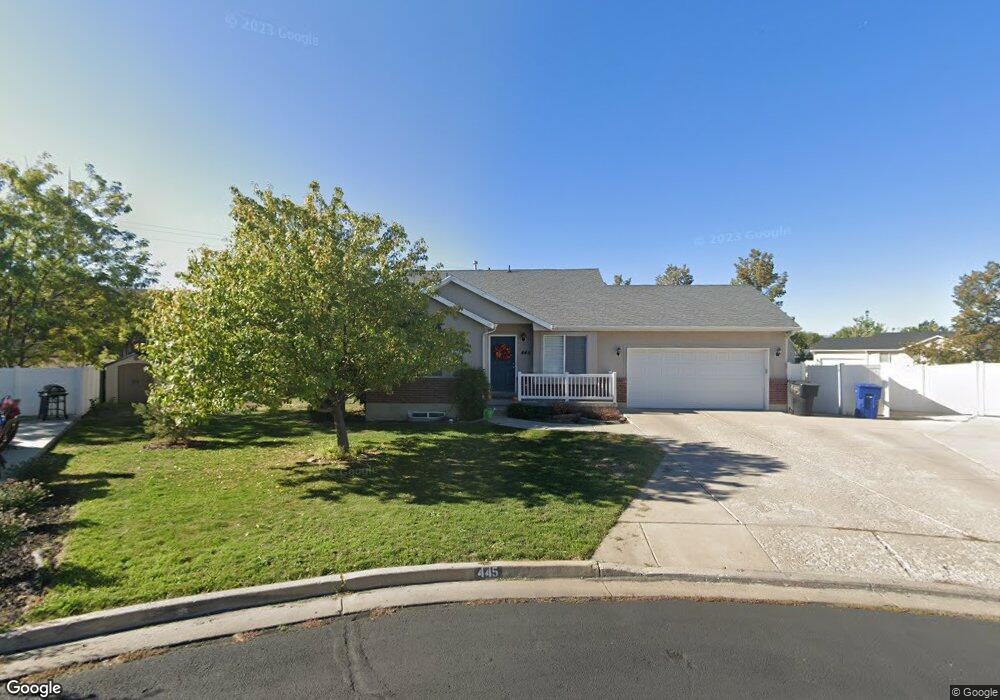
445 Maple Cir North Logan, UT 84341
Estimated Value: $413,000 - $466,000
5
Beds
3
Baths
2,212
Sq Ft
$197/Sq Ft
Est. Value
About This Home
This home is located at 445 Maple Cir, North Logan, UT 84341 and is currently estimated at $436,757, approximately $197 per square foot. 445 Maple Cir is a home located in Cache County with nearby schools including Greenville School, Cedar Ridge School, and North Cache Middle School.
Ownership History
Date
Name
Owned For
Owner Type
Purchase Details
Closed on
Dec 21, 2018
Sold by
Bryner Stephen M and Bryner Janelle H
Bought by
Carr Ryan and Carr Elizabeth Lyman
Current Estimated Value
Home Financials for this Owner
Home Financials are based on the most recent Mortgage that was taken out on this home.
Original Mortgage
$192,000
Outstanding Balance
$169,167
Interest Rate
4.9%
Mortgage Type
New Conventional
Estimated Equity
$267,590
Purchase Details
Closed on
Sep 15, 2014
Sold by
Mullahkhel Bassira A and Mullahkhel Karina Mary
Bought by
Byrner Stephen M and Bryner Janelle H
Home Financials for this Owner
Home Financials are based on the most recent Mortgage that was taken out on this home.
Original Mortgage
$195,106
Interest Rate
4.09%
Mortgage Type
VA
Purchase Details
Closed on
Aug 24, 2001
Sold by
First Equity Federal Inc
Bought by
Evans Coty W
Create a Home Valuation Report for This Property
The Home Valuation Report is an in-depth analysis detailing your home's value as well as a comparison with similar homes in the area
Home Values in the Area
Average Home Value in this Area
Purchase History
| Date | Buyer | Sale Price | Title Company |
|---|---|---|---|
| Carr Ryan | -- | First American Title Insuran | |
| Byrner Stephen M | -- | Hickman Land Title Company | |
| Evans Coty W | -- | -- |
Source: Public Records
Mortgage History
| Date | Status | Borrower | Loan Amount |
|---|---|---|---|
| Open | Carr Ryan | $192,000 | |
| Previous Owner | Byrner Stephen M | $195,106 |
Source: Public Records
Tax History
| Year | Tax Paid | Tax Assessment Tax Assessment Total Assessment is a certain percentage of the fair market value that is determined by local assessors to be the total taxable value of land and additions on the property. | Land | Improvement |
|---|---|---|---|---|
| 2025 | $1,744 | $244,185 | $0 | $0 |
| 2024 | $1,606 | $209,210 | $0 | $0 |
| 2023 | $1,709 | $205,790 | $0 | $0 |
| 2022 | $1,788 | $205,790 | $0 | $0 |
| 2021 | $1,752 | $312,245 | $64,550 | $247,695 |
| 2020 | $1,500 | $250,632 | $64,550 | $186,082 |
| 2019 | $1,571 | $250,631 | $64,550 | $186,081 |
| 2018 | $1,364 | $210,660 | $48,850 | $161,810 |
| 2017 | $1,326 | $107,775 | $0 | $0 |
| 2016 | $1,347 | $107,775 | $0 | $0 |
| 2015 | $1,297 | $103,310 | $0 | $0 |
| 2014 | $1,267 | $103,310 | $0 | $0 |
| 2013 | -- | $101,685 | $0 | $0 |
Source: Public Records
Map
Nearby Homes
- 2640 N Aspen Park Ln
- 2592 N 330 E
- 623 E 2475 N Unit 5
- 645 E 2475 N
- 667 E 2475 N
- 2469 N 620 E Unit 3
- 2477 N 620 E Unit 4
- 2460 N 200 E
- 2452 N 200 E
- 385 E 2280 N Unit D
- 161 E 2440 N
- 2386 N 150 E
- 327 E 2230 N Unit A
- 680 S 50 E Unit 112
- 2284 N 740 E
- 2070 U S 91
- 741 E 2200 N
- 2807 N Main St
- 710 E 2160 N
- 2048 N 350 E
Your Personal Tour Guide
Ask me questions while you tour the home.