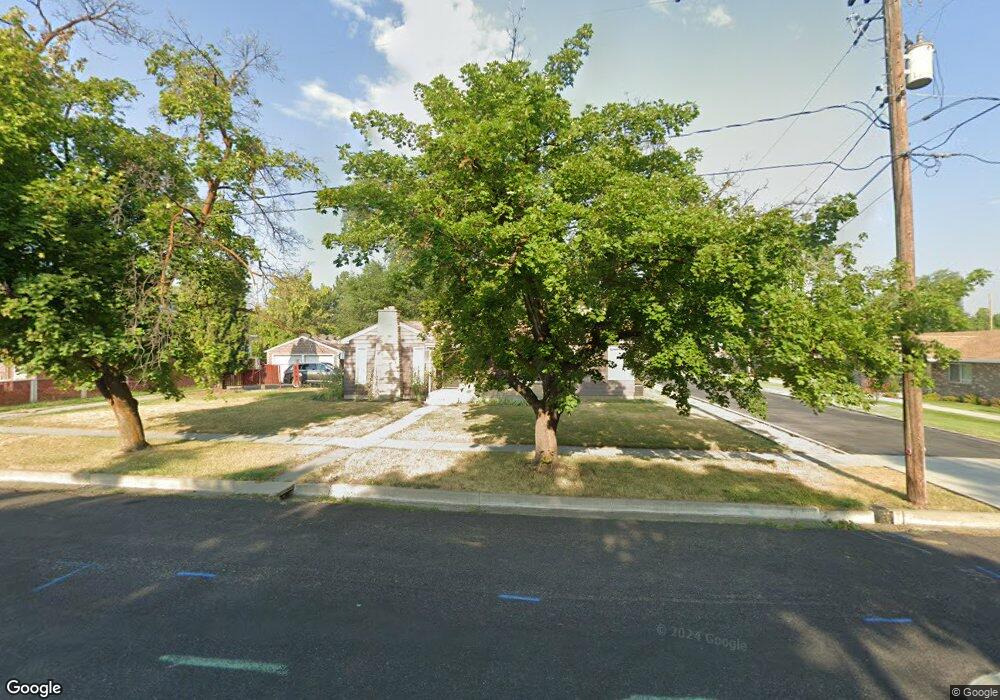
445 N 300 W Logan, UT 84321
Ellis NeighborhoodEstimated Value: $401,000 - $449,000
4
Beds
2
Baths
2,298
Sq Ft
$185/Sq Ft
Est. Value
About This Home
This home is located at 445 N 300 W, Logan, UT 84321 and is currently estimated at $425,176, approximately $185 per square foot. 445 N 300 W is a home located in Cache County with nearby schools including Ellis School, Mount Logan Middle School, and Logan High School.
Ownership History
Date
Name
Owned For
Owner Type
Purchase Details
Closed on
Jun 4, 2012
Sold by
Hsbc Bank Usa Na
Bought by
Miner Michael S and Miner Lisa
Current Estimated Value
Home Financials for this Owner
Home Financials are based on the most recent Mortgage that was taken out on this home.
Original Mortgage
$82,649
Outstanding Balance
$56,708
Interest Rate
3.77%
Mortgage Type
New Conventional
Estimated Equity
$368,468
Purchase Details
Closed on
Feb 3, 2012
Sold by
Clavel Maytee and Mortgage Electronic Registrati
Bought by
Hsbc Bank Usa Na
Purchase Details
Closed on
Nov 2, 2006
Sold by
Birch Creek Holdings One Llc
Bought by
Clavel Maytee
Home Financials for this Owner
Home Financials are based on the most recent Mortgage that was taken out on this home.
Original Mortgage
$104,000
Interest Rate
8.77%
Mortgage Type
Adjustable Rate Mortgage/ARM
Create a Home Valuation Report for This Property
The Home Valuation Report is an in-depth analysis detailing your home's value as well as a comparison with similar homes in the area
Home Values in the Area
Average Home Value in this Area
Purchase History
| Date | Buyer | Sale Price | Title Company |
|---|---|---|---|
| Miner Michael S | $110,199 | First Amer St George Main | |
| Hsbc Bank Usa Na | $121,809 | None Available | |
| Clavel Maytee | -- | Cache Title Company |
Source: Public Records
Mortgage History
| Date | Status | Borrower | Loan Amount |
|---|---|---|---|
| Open | Miner Michael S | $82,649 | |
| Previous Owner | Clavel Maytee | $104,000 |
Source: Public Records
Tax History
| Year | Tax Paid | Tax Assessment Tax Assessment Total Assessment is a certain percentage of the fair market value that is determined by local assessors to be the total taxable value of land and additions on the property. | Land | Improvement |
|---|---|---|---|---|
| 2025 | $1,780 | $230,205 | $0 | $0 |
| 2024 | $1,838 | $230,205 | $0 | $0 |
| 2023 | $1,919 | $229,150 | $0 | $0 |
| 2022 | $2,055 | $229,150 | $0 | $0 |
| 2021 | $1,634 | $281,510 | $44,000 | $237,510 |
| 2020 | $1,462 | $226,700 | $44,000 | $182,700 |
| 2019 | $1,528 | $226,700 | $44,000 | $182,700 |
| 2018 | $1,555 | $210,544 | $44,000 | $166,544 |
| 2017 | $1,480 | $105,985 | $0 | $0 |
| 2016 | $1,535 | $102,135 | $0 | $0 |
| 2015 | $1,481 | $102,135 | $0 | $0 |
| 2014 | $1,317 | $100,485 | $0 | $0 |
| 2013 | -- | $88,870 | $0 | $0 |
Source: Public Records
Map
Nearby Homes
Your Personal Tour Guide
Ask me questions while you tour the home.