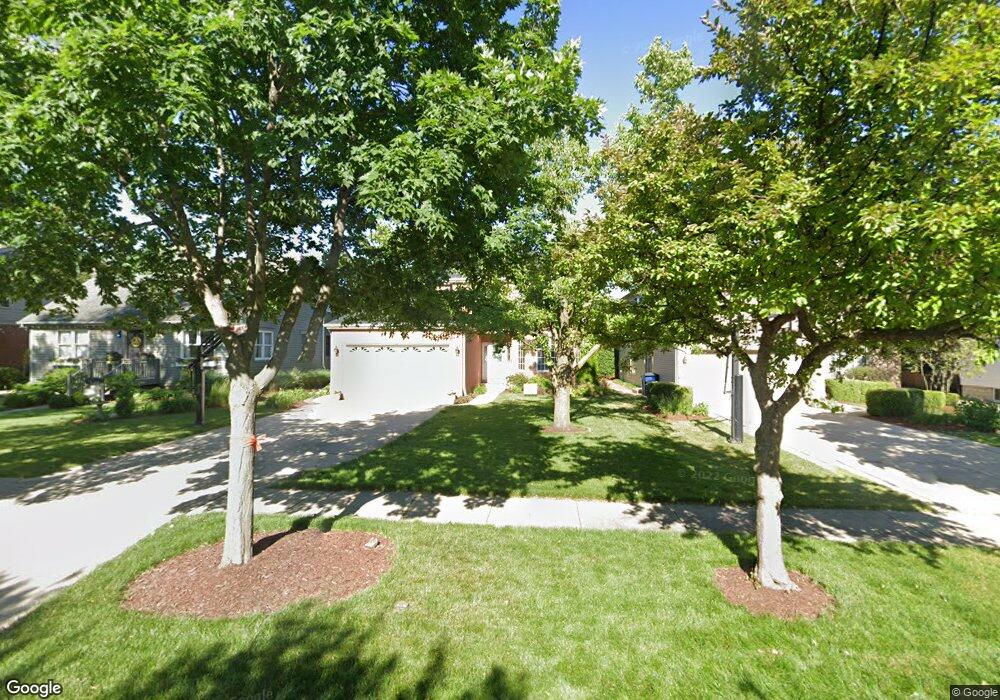
445 N Elm Ave Elmhurst, IL 60126
Estimated Value: $914,307 - $1,190,000
--
Bed
1
Bath
2,860
Sq Ft
$352/Sq Ft
Est. Value
About This Home
This home is located at 445 N Elm Ave, Elmhurst, IL 60126 and is currently estimated at $1,007,327, approximately $352 per square foot. 445 N Elm Ave is a home located in DuPage County with nearby schools including Emerson Elementary School, Churchville Middle School, and York Community High School.
Ownership History
Date
Name
Owned For
Owner Type
Purchase Details
Closed on
Dec 15, 2023
Sold by
Kronstein Jonathan and Kronstein Colleen
Bought by
Jonathan And Colleen Kronstein Family Trust and Kronstein
Current Estimated Value
Purchase Details
Closed on
Oct 10, 1998
Sold by
Mcgovern Michael
Bought by
Kronstein Jonathan and Kronstein Colleen
Home Financials for this Owner
Home Financials are based on the most recent Mortgage that was taken out on this home.
Original Mortgage
$304,000
Interest Rate
6.88%
Purchase Details
Closed on
Aug 8, 1997
Sold by
Norwood Doryce Hughston and Hughston Doryce
Bought by
Mcgovern Michael
Create a Home Valuation Report for This Property
The Home Valuation Report is an in-depth analysis detailing your home's value as well as a comparison with similar homes in the area
Home Values in the Area
Average Home Value in this Area
Purchase History
| Date | Buyer | Sale Price | Title Company |
|---|---|---|---|
| Jonathan And Colleen Kronstein Family Trust | -- | None Listed On Document | |
| Kronstein Jonathan | $380,000 | -- | |
| Mcgovern Michael | $220,000 | Attorneys Title Guaranty Fun |
Source: Public Records
Mortgage History
| Date | Status | Borrower | Loan Amount |
|---|---|---|---|
| Previous Owner | Kronstein Jonathan | $304,000 |
Source: Public Records
Tax History Compared to Growth
Tax History
| Year | Tax Paid | Tax Assessment Tax Assessment Total Assessment is a certain percentage of the fair market value that is determined by local assessors to be the total taxable value of land and additions on the property. | Land | Improvement |
|---|---|---|---|---|
| 2024 | $15,130 | $255,057 | $70,816 | $184,241 |
| 2023 | $13,977 | $234,470 | $65,100 | $169,370 |
| 2022 | $13,727 | $230,090 | $62,300 | $167,790 |
| 2021 | $13,150 | $220,390 | $59,670 | $160,720 |
| 2020 | $12,381 | $211,100 | $57,150 | $153,950 |
| 2019 | $12,264 | $202,980 | $54,950 | $148,030 |
| 2018 | $11,630 | $191,690 | $52,340 | $139,350 |
| 2017 | $11,412 | $183,200 | $50,020 | $133,180 |
| 2016 | $10,950 | $169,140 | $46,180 | $122,960 |
| 2015 | $10,753 | $156,250 | $42,660 | $113,590 |
| 2014 | $10,631 | $142,540 | $35,200 | $107,340 |
| 2013 | $10,581 | $145,450 | $35,920 | $109,530 |
Source: Public Records
Map
Nearby Homes
- 456 N Elm Ave
- 251 W Armitage Ave
- 314 N Elm Ave
- 442 N Oak St
- 262 N Addison Ave
- 260 N Addison Ave
- 258 N Addison Ave
- 254 N Addison Ave
- 412 N Ridgeland Ave
- 468 N Highland Ave
- 322 N Highland Ave
- 183 E Grantley Ave
- 634 N Kenilworth Ave
- 407 W North Ave
- 284 N Highland Ave
- 193 N Elm Ave
- 285 N Ridgeland Ave
- 366 N Highview Ave
- 195 N Addison Ave Unit PH03
- 286 N Indiana St