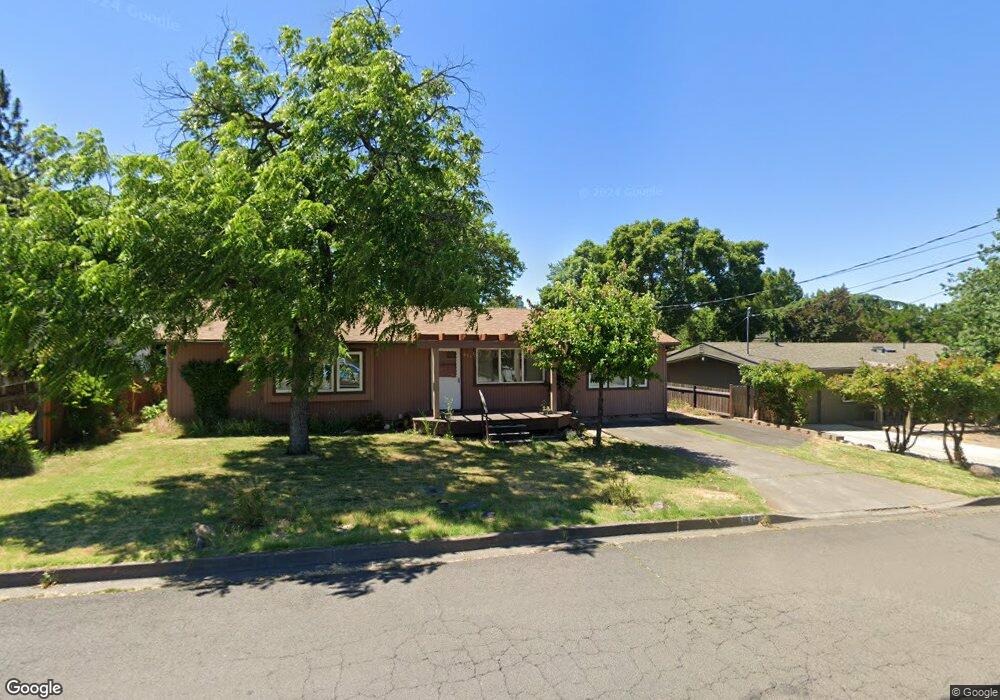
445 N Laurel St Ashland, OR 97520
Quiet Village NeighborhoodEstimated Value: $459,000 - $505,000
3
Beds
2
Baths
1,440
Sq Ft
$332/Sq Ft
Est. Value
About This Home
This home is located at 445 N Laurel St, Ashland, OR 97520 and is currently estimated at $477,834, approximately $331 per square foot. 445 N Laurel St is a home located in Jackson County with nearby schools including Helman Elementary School, Ashland Middle School, and Ashland High School.
Ownership History
Date
Name
Owned For
Owner Type
Purchase Details
Closed on
Feb 10, 2012
Sold by
Boom Anthony A
Bought by
Boom Anthony
Current Estimated Value
Home Financials for this Owner
Home Financials are based on the most recent Mortgage that was taken out on this home.
Original Mortgage
$139,800
Interest Rate
3.86%
Mortgage Type
New Conventional
Purchase Details
Closed on
Jan 31, 2011
Sold by
Boom Anthony A and Moore Kathryn June
Bought by
Boom Anthony A
Home Financials for this Owner
Home Financials are based on the most recent Mortgage that was taken out on this home.
Original Mortgage
$137,500
Interest Rate
4.79%
Mortgage Type
New Conventional
Purchase Details
Closed on
Mar 18, 1999
Sold by
Boom Anthony A
Bought by
Boom Anthony A and Moore Kathryn June
Create a Home Valuation Report for This Property
The Home Valuation Report is an in-depth analysis detailing your home's value as well as a comparison with similar homes in the area
Home Values in the Area
Average Home Value in this Area
Purchase History
| Date | Buyer | Sale Price | Title Company |
|---|---|---|---|
| Boom Anthony | -- | Ticor Title Company Of Or | |
| Boom Anthony A | -- | First American | |
| Boom Anthony A | -- | -- |
Source: Public Records
Mortgage History
| Date | Status | Borrower | Loan Amount |
|---|---|---|---|
| Closed | Boom Anthony | $139,800 | |
| Closed | Boom Anthony A | $137,500 |
Source: Public Records
Tax History
| Year | Tax Paid | Tax Assessment Tax Assessment Total Assessment is a certain percentage of the fair market value that is determined by local assessors to be the total taxable value of land and additions on the property. | Land | Improvement |
|---|---|---|---|---|
| 2026 | $3,803 | $247,300 | -- | -- |
| 2025 | $3,723 | $240,100 | $120,630 | $119,470 |
| 2024 | $3,723 | $233,110 | $117,110 | $116,000 |
| 2023 | $3,601 | $226,330 | $113,710 | $112,620 |
| 2022 | $3,486 | $226,330 | $113,710 | $112,620 |
| 2021 | $3,367 | $219,740 | $110,400 | $109,340 |
| 2020 | $3,273 | $213,340 | $107,180 | $106,160 |
| 2019 | $3,221 | $201,100 | $101,030 | $100,070 |
| 2018 | $3,043 | $195,250 | $98,090 | $97,160 |
| 2017 | $3,021 | $195,250 | $98,090 | $97,160 |
| 2016 | $2,942 | $184,050 | $92,470 | $91,580 |
| 2015 | $2,828 | $184,050 | $92,470 | $91,580 |
| 2014 | $2,737 | $173,490 | $87,170 | $86,320 |
Source: Public Records
Map
Nearby Homes
- 372 Glenn St
- 536 Parkside Dr
- 381 Glenn St
- 583 Coffee Ln
- 566 Coffee Ln
- 216 Central Ave
- 563 Rock and 152 Maple St
- 563 Rock St & 152 Maple St
- 816 Voris Ave
- 852 Oak St
- 98 Dunn Cir
- 119 Oak Meadows Place
- 668 N Main St
- 115 Oak Meadows Place
- 100 Dunn Cir
- 218 Alicia St
- 692 Vansant St
- 283 High St
- 153 E Hersey St Unit A
- 369 Alta Ave
- 435 N Laurel St
- 455 N Laurel St
- 448 Drager St
- 456 Drager St
- 440 Drager St
- 416 N Laurel St
- 0 N Laurel St
- 467 N Laurel St
- 425 N Laurel St
- 446 N Laurel St
- 456 N Laurel St
- 468 Drager St
- 436 N Laurel St
- 256 N Laurel St
- 468 N Laurel St
- 475 N Laurel St
- 480 Drager St
- 265 Orange Ave
- 213 Eastbrook Way
- 0 Orange Ave
Your Personal Tour Guide
Ask me questions while you tour the home.