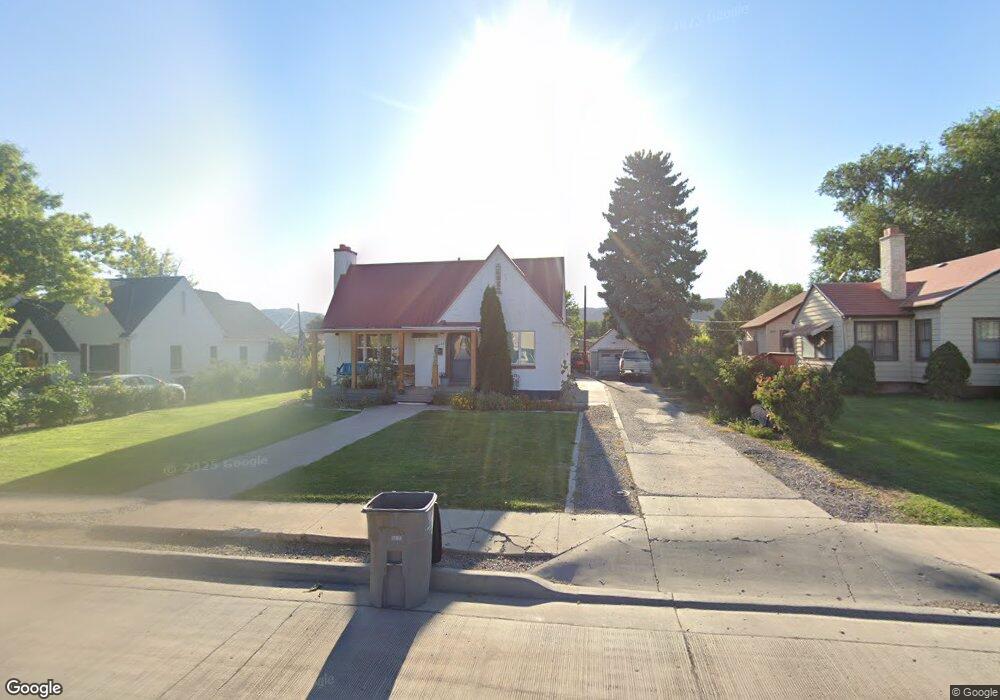
445 N Main St Richfield, UT 84701
Estimated Value: $296,000 - $324,000
3
Beds
2
Baths
2,463
Sq Ft
$127/Sq Ft
Est. Value
About This Home
This home is located at 445 N Main St, Richfield, UT 84701 and is currently estimated at $312,539, approximately $126 per square foot. 445 N Main St is a home located in Sevier County with nearby schools including Pahvant School, Ashman School, and Red Hills Middle School.
Ownership History
Date
Name
Owned For
Owner Type
Purchase Details
Closed on
Nov 24, 2025
Sold by
Harvey Robbi K
Bought by
Pieper Mark Andrew and Pieper Lexis Rachel
Current Estimated Value
Home Financials for this Owner
Home Financials are based on the most recent Mortgage that was taken out on this home.
Original Mortgage
$447,663
Outstanding Balance
$447,663
Interest Rate
6.3%
Mortgage Type
Credit Line Revolving
Estimated Equity
-$135,124
Purchase Details
Closed on
Mar 21, 2017
Sold by
Rosenvall Evelyn
Bought by
Pieper Mark and Pieper Lexis
Home Financials for this Owner
Home Financials are based on the most recent Mortgage that was taken out on this home.
Original Mortgage
$82,640
Interest Rate
4.17%
Create a Home Valuation Report for This Property
The Home Valuation Report is an in-depth analysis detailing your home's value as well as a comparison with similar homes in the area
Purchase History
| Date | Buyer | Sale Price | Title Company |
|---|---|---|---|
| Pieper Mark Andrew | -- | Professional Title | |
| Pieper Mark | -- | Mountain View Title |
Source: Public Records
Mortgage History
| Date | Status | Borrower | Loan Amount |
|---|---|---|---|
| Open | Pieper Mark Andrew | $447,663 | |
| Previous Owner | Pieper Mark | $82,640 |
Source: Public Records
Tax History
| Year | Tax Paid | Tax Assessment Tax Assessment Total Assessment is a certain percentage of the fair market value that is determined by local assessors to be the total taxable value of land and additions on the property. | Land | Improvement |
|---|---|---|---|---|
| 2025 | $1,376 | $141,774 | $41,562 | $100,212 |
| 2024 | $1,376 | $148,133 | $33,943 | $114,190 |
| 2023 | $1,466 | $164,021 | $31,228 | $132,793 |
| 2022 | $1,477 | $134,825 | $26,638 | $108,187 |
| 2021 | $1,320 | $101,448 | $27,397 | $74,051 |
| 2020 | $1,060 | $79,163 | $17,464 | $61,699 |
| 2019 | $899 | $71,140 | $14,550 | $56,590 |
| 2018 | $888 | $62,960 | $14,550 | $48,410 |
| 2017 | $855 | $57,850 | $14,550 | $43,300 |
| 2016 | $730 | $57,850 | $0 | $0 |
| 2015 | $730 | $56,380 | $0 | $0 |
| 2014 | $730 | $53,640 | $0 | $0 |
Source: Public Records
Map
Nearby Homes
Your Personal Tour Guide
Ask me questions while you tour the home.