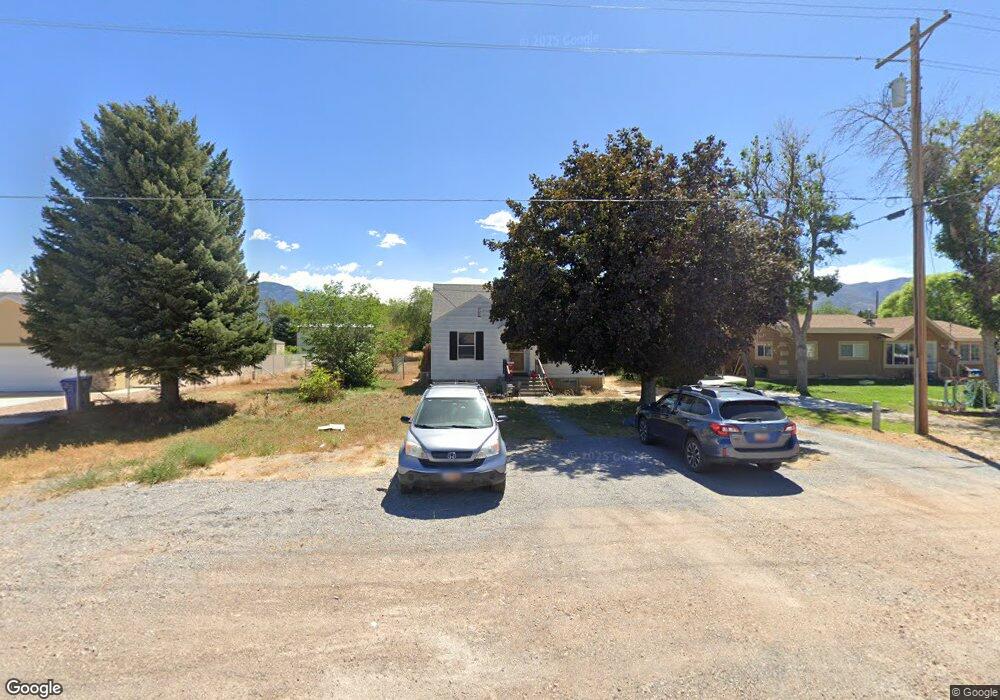
445 S 100 W Fillmore, UT 84631
Estimated Value: $270,000 - $335,000
3
Beds
2
Baths
1,616
Sq Ft
$183/Sq Ft
Est. Value
About This Home
This home is located at 445 S 100 W, Fillmore, UT 84631 and is currently estimated at $296,242, approximately $183 per square foot. 445 S 100 W is a home located in Millard County.
Ownership History
Date
Name
Owned For
Owner Type
Purchase Details
Closed on
Dec 29, 2016
Sold by
Bond Morgan L and Taylor Jaycie D
Bought by
Dewolf Derek
Current Estimated Value
Home Financials for this Owner
Home Financials are based on the most recent Mortgage that was taken out on this home.
Original Mortgage
$101,010
Outstanding Balance
$82,396
Interest Rate
3.94%
Mortgage Type
New Conventional
Estimated Equity
$213,846
Purchase Details
Closed on
Jan 8, 2013
Sold by
Rowley Freeman Rex and Rowley Claudia Lajeanne
Bought by
Bond Morgan L and Taylor Jaycie D
Home Financials for this Owner
Home Financials are based on the most recent Mortgage that was taken out on this home.
Original Mortgage
$102,040
Interest Rate
3.28%
Mortgage Type
New Conventional
Purchase Details
Closed on
Jun 15, 2012
Sold by
Rowley Freeman Rex and Rowley John Thomas
Bought by
Rowley Freeman Rex and Rowley Claudia Lajeanne
Purchase Details
Closed on
May 13, 2011
Sold by
Rowley Robert
Bought by
Rowley Freeman Rex and Rowley John Thomas
Create a Home Valuation Report for This Property
The Home Valuation Report is an in-depth analysis detailing your home's value as well as a comparison with similar homes in the area
Home Values in the Area
Average Home Value in this Area
Purchase History
| Date | Buyer | Sale Price | Title Company |
|---|---|---|---|
| Dewolf Derek | -- | First American Title | |
| Bond Morgan L | -- | -- | |
| Rowley Freeman Rex | -- | -- | |
| Rowley Freeman Rex | -- | -- |
Source: Public Records
Mortgage History
| Date | Status | Borrower | Loan Amount |
|---|---|---|---|
| Open | Dewolf Derek | $101,010 | |
| Previous Owner | Bond Morgan L | $102,040 |
Source: Public Records
Tax History Compared to Growth
Tax History
| Year | Tax Paid | Tax Assessment Tax Assessment Total Assessment is a certain percentage of the fair market value that is determined by local assessors to be the total taxable value of land and additions on the property. | Land | Improvement |
|---|---|---|---|---|
| 2025 | $895 | $112,365 | $22,696 | $89,669 |
| 2024 | $895 | $102,290 | $20,292 | $81,998 |
| 2023 | $1,141 | $102,290 | $20,292 | $81,998 |
| 2022 | $875 | $78,538 | $18,448 | $60,090 |
| 2021 | $753 | $64,916 | $11,979 | $52,937 |
| 2020 | $696 | $60,393 | $10,890 | $49,503 |
| 2019 | $599 | $52,113 | $10,890 | $41,223 |
| 2018 | $572 | $50,950 | $10,890 | $40,060 |
| 2017 | $575 | $48,704 | $10,890 | $37,814 |
| 2016 | $550 | $48,704 | $10,890 | $37,814 |
| 2015 | $551 | $48,704 | $10,890 | $37,814 |
| 2014 | -- | $48,704 | $10,890 | $37,814 |
| 2013 | -- | $33,845 | $10,890 | $22,955 |
Source: Public Records
Map
Nearby Homes
- 190 W 400 St S
- 155 E 500 St S
- 157 E 500 South St
- 220 S 200 E
- 405 E 500 St S
- 40 S 100 Rd E
- 310 S 500 West Rd
- 430 E Canyon Rd
- 75 N 100 West St
- 760 E 700 St S
- 310 S 600 E
- 165 N 100 W
- 225 W 200 St N
- 690 E 500 S
- 295 N 100 West St
- 1100 S 725 Rd W
- 750 800 South Fillmore
- 825 800 South Fillmore
- 800 800 South Fillmore
- 390 N 100 W