Estimated Value: $489,322 - $589,000
4
Beds
3
Baths
2,340
Sq Ft
$239/Sq Ft
Est. Value
About This Home
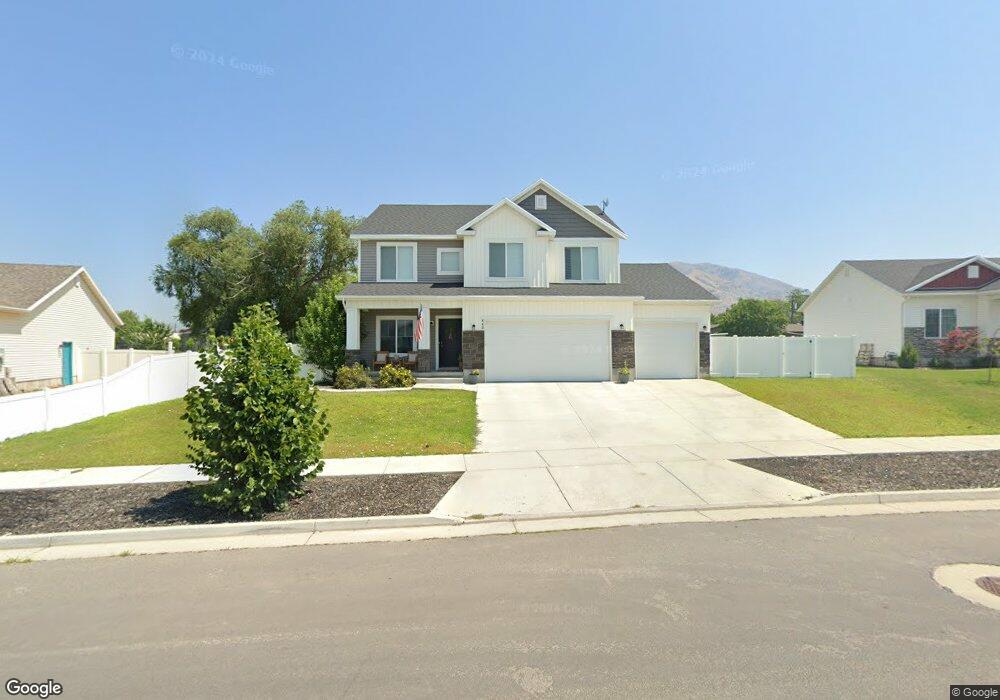
This home is located at 445 S 400 E, Hyrum, UT 84319 and is currently estimated at $559,081, approximately $238 per square foot. 445 S 400 E is a home located in Cache County with nearby schools including Millville School, South Cache Middle School, and Mountain Crest High School.
Ownership History
Date
Name
Owned For
Owner Type
Purchase Details
Closed on
Apr 8, 2019
Sold by
Kartchner Homes Cv Division Inc
Bought by
Cole Rich Laramie and Rich Leah Joy
Current Estimated Value
Home Financials for this Owner
Home Financials are based on the most recent Mortgage that was taken out on this home.
Original Mortgage
$271,920
Outstanding Balance
$238,086
Interest Rate
4.3%
Mortgage Type
New Conventional
Estimated Equity
$320,995
Create a Home Valuation Report for This Property
The Home Valuation Report is an in-depth analysis detailing your home's value as well as a comparison with similar homes in the area
Home Values in the Area
Average Home Value in this Area
Purchase History
| Date | Buyer | Sale Price | Title Company |
|---|---|---|---|
| Cole Rich Laramie | -- | Cache Title Logan |
Source: Public Records
Mortgage History
| Date | Status | Borrower | Loan Amount |
|---|---|---|---|
| Open | Cole Rich Laramie | $271,920 |
Source: Public Records
Tax History
| Year | Tax Paid | Tax Assessment Tax Assessment Total Assessment is a certain percentage of the fair market value that is determined by local assessors to be the total taxable value of land and additions on the property. | Land | Improvement |
|---|---|---|---|---|
| 2025 | $1,761 | $252,780 | $0 | $0 |
| 2024 | $1,876 | $251,550 | $0 | $0 |
| 2023 | $2,258 | $289,520 | $0 | $0 |
| 2022 | $2,357 | $289,520 | $0 | $0 |
| 2021 | $205 | $387,340 | $75,000 | $312,340 |
| 2020 | $1,951 | $346,600 | $75,000 | $271,600 |
| 2019 | $2,015 | $336,600 | $65,000 | $271,600 |
| 2018 | $732 | $65,000 | $65,000 | $0 |
| 2016 | -- | $0 | $0 | $0 |
| 2015 | -- | $0 | $0 | $0 |
Source: Public Records
Map
Nearby Homes
Your Personal Tour Guide
Ask me questions while you tour the home.