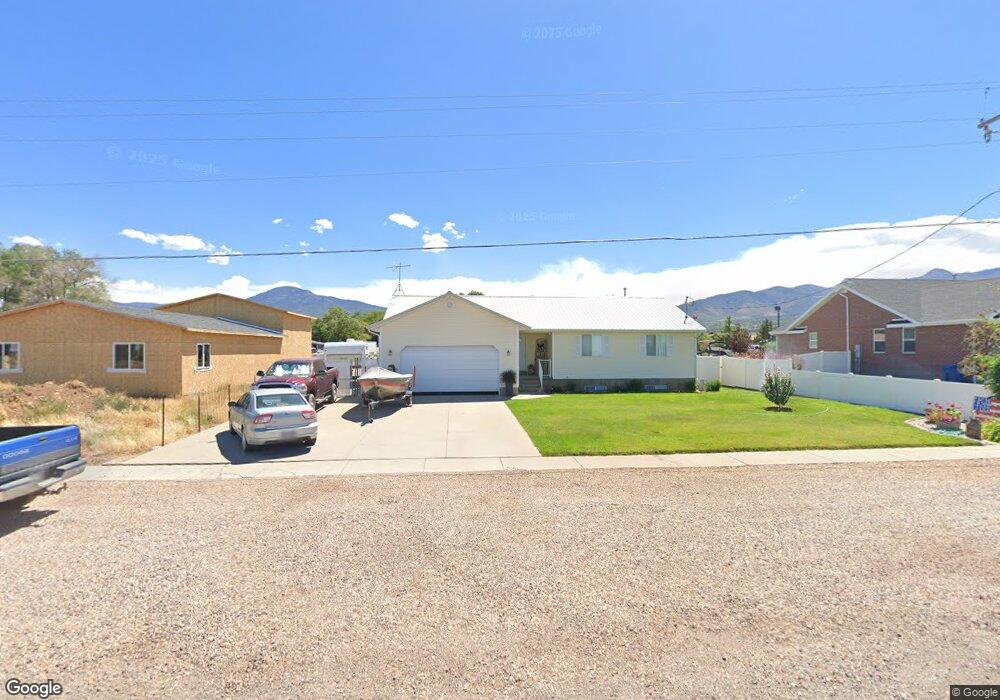
445 S 400 W Fillmore, UT 84631
Estimated Value: $298,000 - $418,272
--
Bed
--
Bath
--
Sq Ft
0.28
Acres
About This Home
This home is located at 445 S 400 W, Fillmore, UT 84631 and is currently estimated at $373,068. 445 S 400 W is a home.
Ownership History
Date
Name
Owned For
Owner Type
Purchase Details
Closed on
Sep 19, 2008
Sold by
Holley Brian N and Holley Christina R
Bought by
Pace Valyn F and Pace Matthew D
Current Estimated Value
Home Financials for this Owner
Home Financials are based on the most recent Mortgage that was taken out on this home.
Original Mortgage
$112,000
Outstanding Balance
$55,823
Interest Rate
6.43%
Mortgage Type
New Conventional
Estimated Equity
$317,245
Purchase Details
Closed on
May 30, 2006
Sold by
Holley Brain Bn and Holley Brian H
Bought by
Holley Brain N and Holley Christina R
Home Financials for this Owner
Home Financials are based on the most recent Mortgage that was taken out on this home.
Original Mortgage
$127,500
Interest Rate
6.55%
Mortgage Type
New Conventional
Create a Home Valuation Report for This Property
The Home Valuation Report is an in-depth analysis detailing your home's value as well as a comparison with similar homes in the area
Home Values in the Area
Average Home Value in this Area
Purchase History
| Date | Buyer | Sale Price | Title Company |
|---|---|---|---|
| Pace Valyn F | -- | -- | |
| Holley Brain N | -- | -- |
Source: Public Records
Mortgage History
| Date | Status | Borrower | Loan Amount |
|---|---|---|---|
| Open | Pace Valyn F | $112,000 | |
| Previous Owner | Holley Brain N | $127,500 |
Source: Public Records
Tax History Compared to Growth
Tax History
| Year | Tax Paid | Tax Assessment Tax Assessment Total Assessment is a certain percentage of the fair market value that is determined by local assessors to be the total taxable value of land and additions on the property. | Land | Improvement |
|---|---|---|---|---|
| 2025 | $1,852 | $232,588 | $21,722 | $210,866 |
| 2024 | $200,739 | $200,739 | $20,292 | $180,447 |
| 2023 | $200,739 | $200,739 | $20,292 | $180,447 |
| 2022 | $1,603 | $143,957 | $18,448 | $125,509 |
| 2021 | $1,421 | $122,547 | $11,979 | $110,568 |
| 2020 | $1,155 | $100,119 | $10,890 | $89,229 |
| 2019 | $979 | $85,194 | $10,890 | $74,304 |
| 2018 | $933 | $83,099 | $10,890 | $72,209 |
| 2017 | $830 | $70,265 | $10,890 | $59,375 |
| 2016 | $794 | $70,265 | $10,890 | $59,375 |
| 2015 | $770 | $68,087 | $10,890 | $57,197 |
| 2014 | -- | $68,087 | $10,890 | $57,197 |
| 2013 | -- | $68,087 | $10,890 | $57,197 |
Source: Public Records
Map
Nearby Homes