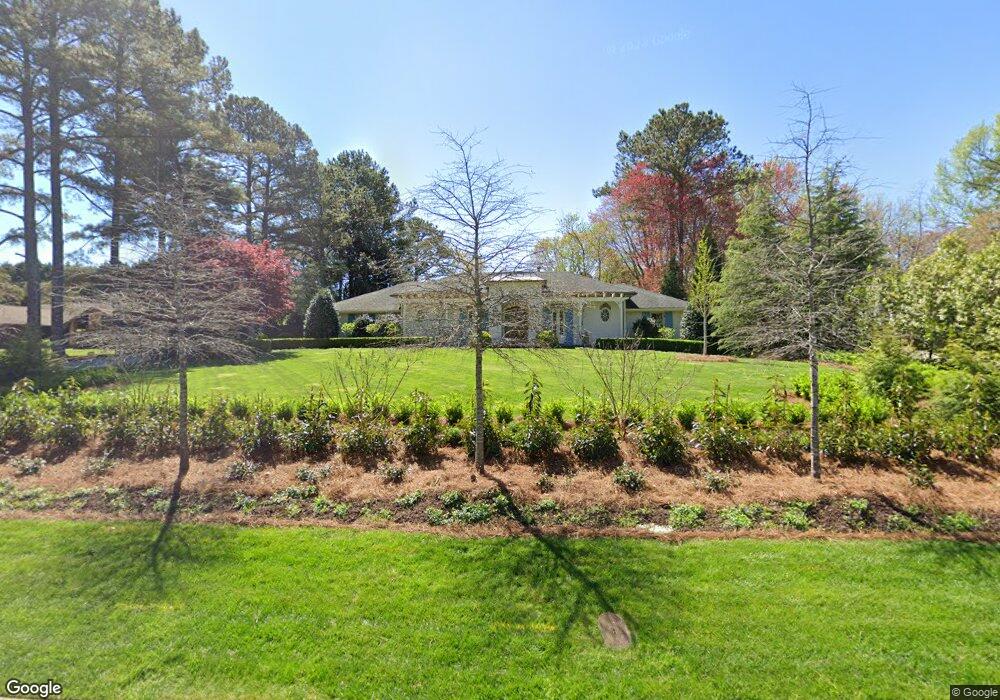
445 Saddle Horn Cir Unit 3 Roswell, GA 30076
Saddle Creek NeighborhoodEstimated Value: $684,000 - $845,316
4
Beds
4
Baths
1,868
Sq Ft
$408/Sq Ft
Est. Value
About This Home
This home is located at 445 Saddle Horn Cir Unit 3, Roswell, GA 30076 and is currently estimated at $762,829, approximately $408 per square foot. 445 Saddle Horn Cir Unit 3 is a home located in Fulton County with nearby schools including Sweet Apple Elementary School, Elkins Pointe Middle School, and Milton High School.
Ownership History
Date
Name
Owned For
Owner Type
Purchase Details
Closed on
Mar 4, 2016
Sold by
Duncan Gary W
Bought by
Regus Robert J and Regus Mary Kelly Collins
Current Estimated Value
Home Financials for this Owner
Home Financials are based on the most recent Mortgage that was taken out on this home.
Original Mortgage
$291,200
Outstanding Balance
$231,018
Interest Rate
3.72%
Mortgage Type
New Conventional
Estimated Equity
$531,811
Purchase Details
Closed on
Oct 16, 2006
Sold by
Mehaffey George
Bought by
Duncan Gary W
Home Financials for this Owner
Home Financials are based on the most recent Mortgage that was taken out on this home.
Original Mortgage
$26,050
Interest Rate
6.39%
Mortgage Type
Stand Alone Refi Refinance Of Original Loan
Purchase Details
Closed on
Jan 26, 2006
Sold by
Wheby Marion R
Bought by
Mehaffey George
Create a Home Valuation Report for This Property
The Home Valuation Report is an in-depth analysis detailing your home's value as well as a comparison with similar homes in the area
Home Values in the Area
Average Home Value in this Area
Purchase History
| Date | Buyer | Sale Price | Title Company |
|---|---|---|---|
| Regus Robert J | $364,000 | -- | |
| Duncan Gary W | $260,600 | -- | |
| Mehaffey George | $225,000 | -- |
Source: Public Records
Mortgage History
| Date | Status | Borrower | Loan Amount |
|---|---|---|---|
| Open | Regus Robert J | $291,200 | |
| Previous Owner | Duncan Gary W | $26,050 |
Source: Public Records
Tax History Compared to Growth
Tax History
| Year | Tax Paid | Tax Assessment Tax Assessment Total Assessment is a certain percentage of the fair market value that is determined by local assessors to be the total taxable value of land and additions on the property. | Land | Improvement |
|---|---|---|---|---|
| 2025 | $1,000 | $302,000 | $66,360 | $235,640 |
| 2023 | $6,186 | $219,160 | $66,080 | $153,080 |
| 2022 | $2,768 | $199,280 | $45,240 | $154,040 |
| 2021 | $3,319 | $196,840 | $31,120 | $165,720 |
| 2020 | $3,369 | $194,480 | $30,720 | $163,760 |
| 2019 | $584 | $159,320 | $33,000 | $126,320 |
| 2018 | $3,618 | $155,560 | $32,200 | $123,360 |
| 2017 | $2,888 | $110,920 | $20,880 | $90,040 |
| 2016 | $3,237 | $110,920 | $20,880 | $90,040 |
| 2015 | $3,855 | $110,920 | $20,880 | $90,040 |
| 2014 | $3,087 | $100,720 | $18,960 | $81,760 |
Source: Public Records
Map
Nearby Homes
- 220 Hollyberry Dr
- 220 Hollyberry Ct
- 600 Rounsaville Rd
- 225 Maison Ct
- 11260 Houze Rd
- 230 Bluff Oak Dr
- 300 Saddle Creek Ln
- 5022 Towneship Creek Rd
- 120 Gala Ct
- 1115 Primrose Dr
- 565 Camber Woods Dr
- 530 Camber Woods Dr
- 1110 Arya Dr
- 1000 Sterling Ct
- 2230 Ashton Dr
- 1012 Towneship Way
- 1002 Towneship Way
- 1055 Wellers Ct
- 5000 Lexington Dr
- 445 Saddle Horn Cir
- 435 Saddle Horn Cir
- 455 Saddle Horn Cir Unit 3
- 480 Hembree Rd
- 200 Hedge Row Hollow
- 465 Saddle Horn Cir
- 465 Saddle Horn Cir Unit 3
- 425 Saddle Horn Cir
- 490 Hembree Rd
- 470 Hembree Rd
- 420 Saddle Horn Cir
- 500 Hembree Rd
- 460 Hembree Rd
- 410 Saddle Horn Cir
- 475 Saddle Horn Cir
- 415 Saddle Horn Cir
- 210 Hedge Row Hollow
- 460 Saddle Horn Cir
- 510 Hembree Rd
- 400 Saddle Horn Cir