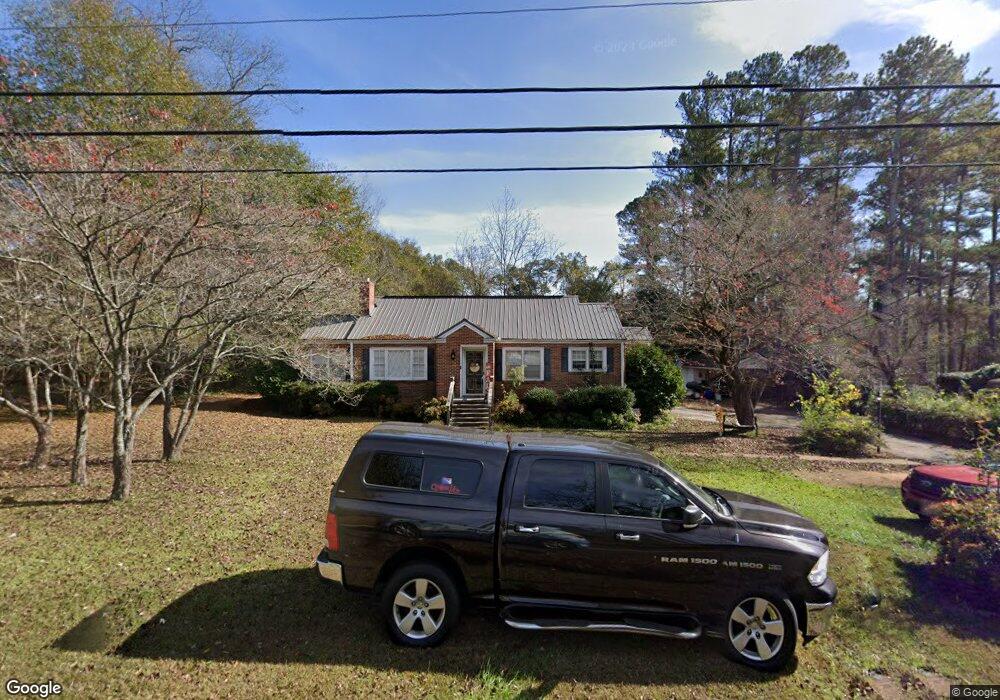
445 Scott St Commerce, GA 30529
Estimated Value: $268,000 - $340,000
3
Beds
2
Baths
1,850
Sq Ft
$158/Sq Ft
Est. Value
About This Home
This home is located at 445 Scott St, Commerce, GA 30529 and is currently estimated at $292,815, approximately $158 per square foot. 445 Scott St is a home located in Jackson County with nearby schools including Commerce Primary School, Commerce Elementary School, and Commerce Middle School.
Ownership History
Date
Name
Owned For
Owner Type
Purchase Details
Closed on
Jul 20, 2021
Sold by
Bryant William
Bought by
Mckenzie Mark S
Current Estimated Value
Home Financials for this Owner
Home Financials are based on the most recent Mortgage that was taken out on this home.
Original Mortgage
$218,090
Outstanding Balance
$196,053
Interest Rate
3%
Mortgage Type
FHA
Estimated Equity
$96,762
Purchase Details
Closed on
Mar 31, 2016
Sold by
Miller Terrence S
Bought by
Bryant William and Bryant Abbie
Home Financials for this Owner
Home Financials are based on the most recent Mortgage that was taken out on this home.
Original Mortgage
$122,735
Interest Rate
3.75%
Mortgage Type
FHA
Purchase Details
Closed on
Jan 29, 2002
Sold by
Beauchamp Kimberly A
Bought by
Miller Terrence S and Miller Stacey L
Purchase Details
Closed on
Jan 21, 1999
Sold by
Standridge Luther D
Bought by
Beauchamp Kimberly A
Create a Home Valuation Report for This Property
The Home Valuation Report is an in-depth analysis detailing your home's value as well as a comparison with similar homes in the area
Home Values in the Area
Average Home Value in this Area
Purchase History
| Date | Buyer | Sale Price | Title Company |
|---|---|---|---|
| Mckenzie Mark S | $226,000 | -- | |
| Bryant William | $125,000 | -- | |
| Miller Terrence S | $116,000 | -- | |
| Beauchamp Kimberly A | $70,900 | -- |
Source: Public Records
Mortgage History
| Date | Status | Borrower | Loan Amount |
|---|---|---|---|
| Open | Mckenzie Mark S | $218,090 | |
| Previous Owner | Bryant William | $122,735 |
Source: Public Records
Tax History
| Year | Tax Paid | Tax Assessment Tax Assessment Total Assessment is a certain percentage of the fair market value that is determined by local assessors to be the total taxable value of land and additions on the property. | Land | Improvement |
|---|---|---|---|---|
| 2025 | $2,329 | $87,216 | $18,800 | $68,416 |
| 2024 | $2,329 | $87,216 | $18,800 | $68,416 |
| 2023 | $2,408 | $79,336 | $18,800 | $60,536 |
| 2022 | $1,890 | $58,296 | $10,960 | $47,336 |
| 2021 | $1,887 | $58,296 | $10,960 | $47,336 |
| 2020 | $1,808 | $49,896 | $10,960 | $38,936 |
| 2019 | $1,834 | $49,896 | $10,960 | $38,936 |
| 2018 | $1,761 | $48,324 | $10,960 | $37,364 |
| 2017 | $1,648 | $44,423 | $10,987 | $33,436 |
| 2016 | $1,580 | $42,995 | $9,559 | $33,436 |
| 2015 | $1,617 | $42,995 | $9,559 | $33,436 |
| 2014 | $1,272 | $33,696 | $9,559 | $24,137 |
| 2013 | -- | $31,582 | $9,009 | $22,572 |
Source: Public Records
Map
Nearby Homes
Your Personal Tour Guide
Ask me questions while you tour the home.