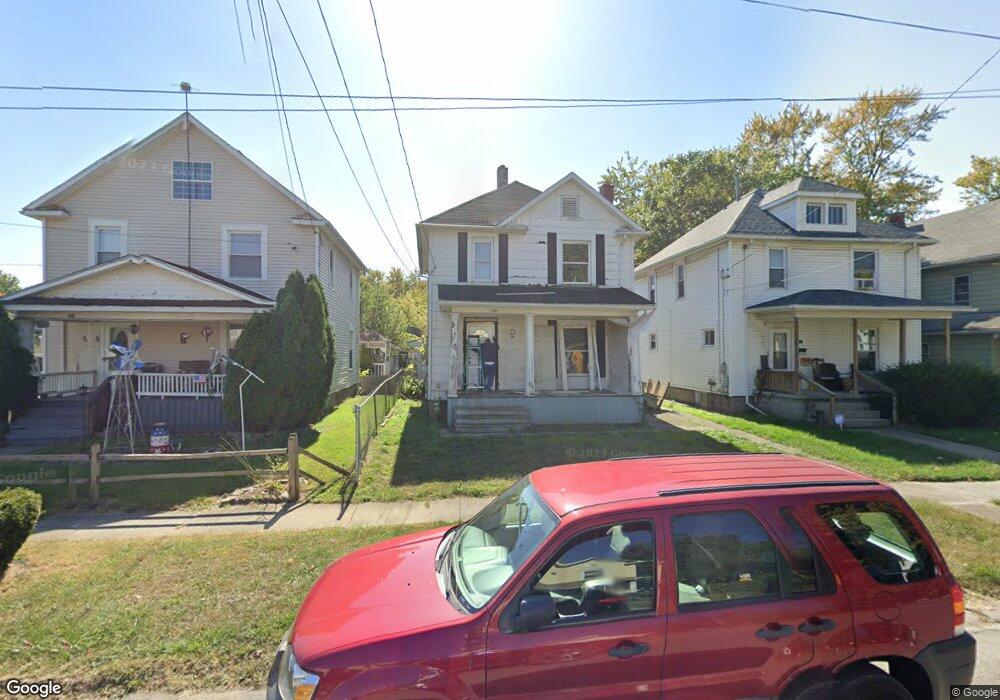
445 Silver St Marion, OH 43302
Estimated Value: $93,000 - $119,000
3
Beds
2
Baths
1,664
Sq Ft
$67/Sq Ft
Est. Value
About This Home
This home is located at 445 Silver St, Marion, OH 43302 and is currently estimated at $111,750, approximately $67 per square foot. 445 Silver St is a home located in Marion County with nearby schools including Rutherford B. Hayes Elementary School, Ulysses S. Grant Middle School, and Harding High School.
Ownership History
Date
Name
Owned For
Owner Type
Purchase Details
Closed on
Feb 7, 2007
Sold by
Granger Matthew R
Bought by
Tubbs Brian and Heller Tubbs Tina M
Current Estimated Value
Home Financials for this Owner
Home Financials are based on the most recent Mortgage that was taken out on this home.
Original Mortgage
$76,500
Interest Rate
9.25%
Mortgage Type
Adjustable Rate Mortgage/ARM
Purchase Details
Closed on
Nov 12, 2004
Bought by
Tubbs Brian
Purchase Details
Closed on
Jul 15, 2004
Bought by
Tubbs Brian
Purchase Details
Closed on
May 1, 2000
Bought by
Tubbs Brian
Purchase Details
Closed on
Dec 10, 1996
Bought by
Tubbs Brian
Create a Home Valuation Report for This Property
The Home Valuation Report is an in-depth analysis detailing your home's value as well as a comparison with similar homes in the area
Home Values in the Area
Average Home Value in this Area
Purchase History
| Date | Buyer | Sale Price | Title Company |
|---|---|---|---|
| Tubbs Brian | $85,000 | Eagle Title L L C | |
| Tubbs Brian | -- | -- | |
| Tubbs Brian | -- | -- | |
| Tubbs Brian | $40,500 | -- | |
| Tubbs Brian | -- | -- |
Source: Public Records
Mortgage History
| Date | Status | Borrower | Loan Amount |
|---|---|---|---|
| Previous Owner | Tubbs Brian | $76,500 |
Source: Public Records
Tax History
| Year | Tax Paid | Tax Assessment Tax Assessment Total Assessment is a certain percentage of the fair market value that is determined by local assessors to be the total taxable value of land and additions on the property. | Land | Improvement |
|---|---|---|---|---|
| 2025 | $914 | $19,010 | $1,240 | $17,770 |
| 2024 | $914 | $21,340 | $1,180 | $20,160 |
| 2023 | $914 | $22,560 | $1,180 | $21,380 |
| 2022 | $962 | $22,560 | $1,180 | $21,380 |
| 2021 | $1,137 | $17,480 | $1,030 | $16,450 |
| 2020 | $976 | $17,480 | $1,030 | $16,450 |
| 2019 | $1,027 | $17,480 | $1,030 | $16,450 |
| 2018 | $1,068 | $17,220 | $1,000 | $16,220 |
| 2017 | $1,063 | $17,220 | $1,000 | $16,220 |
| 2016 | $668 | $17,220 | $1,000 | $16,220 |
| 2015 | $669 | $16,860 | $960 | $15,900 |
| 2014 | $734 | $16,860 | $960 | $15,900 |
| 2012 | $675 | $16,870 | $1,030 | $15,840 |
Source: Public Records
Map
Nearby Homes
- 343 Commercial St
- 230 Edwards St
- 384 Mary St
- 233 Tully St
- 389 Oak St
- 138 Park Blvd
- 187 Olney Ave
- 324 W Church St
- 199 Olney Ave
- 408 Scranton Ave
- 438 N Prospect St Unit 434
- 641 Blake Ave
- 245 Park Blvd
- 414 Thompson St
- 805 Silver St
- 374 Nunin Ct
- 532 N Prospect St
- 552 N Prospect St
- 531 N Main St
- 213 Sharp St
Your Personal Tour Guide
Ask me questions while you tour the home.