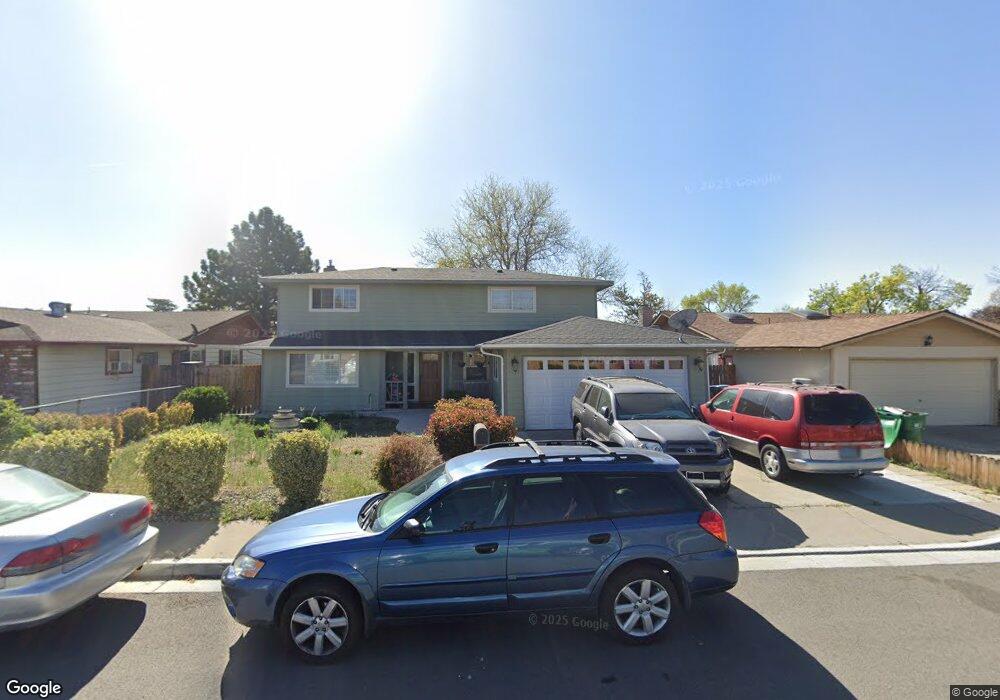
445 Steffanie Way Sparks, NV 89431
McCarran Boulevard-Probasco NeighborhoodEstimated Value: $452,764 - $508,000
5
Beds
3
Baths
1,994
Sq Ft
$242/Sq Ft
Est. Value
About This Home
This home is located at 445 Steffanie Way, Sparks, NV 89431 and is currently estimated at $481,941, approximately $241 per square foot. 445 Steffanie Way is a home located in Washoe County with nearby schools including Lena Juniper Elementary School, Lou Mendive Middle School, and Edward C Reed High School.
Ownership History
Date
Name
Owned For
Owner Type
Purchase Details
Closed on
Oct 18, 2002
Sold by
Mariano Ramon M
Bought by
Mariano Emerita F
Current Estimated Value
Purchase Details
Closed on
Nov 22, 1995
Sold by
Ward Rosalie R
Bought by
Mariano Ramon M and Mariano Emerita F
Home Financials for this Owner
Home Financials are based on the most recent Mortgage that was taken out on this home.
Original Mortgage
$130,150
Interest Rate
7.51%
Purchase Details
Closed on
Sep 16, 1994
Sold by
Thomas Florence A
Bought by
Ward Rosalie R
Home Financials for this Owner
Home Financials are based on the most recent Mortgage that was taken out on this home.
Original Mortgage
$113,600
Interest Rate
8.25%
Create a Home Valuation Report for This Property
The Home Valuation Report is an in-depth analysis detailing your home's value as well as a comparison with similar homes in the area
Home Values in the Area
Average Home Value in this Area
Purchase History
| Date | Buyer | Sale Price | Title Company |
|---|---|---|---|
| Mariano Emerita F | -- | -- | |
| Mariano Ramon M | $137,000 | Stewart Title | |
| Ward Rosalie R | -- | First Centennial Title Co |
Source: Public Records
Mortgage History
| Date | Status | Borrower | Loan Amount |
|---|---|---|---|
| Closed | Mariano Ramon M | $130,150 | |
| Previous Owner | Ward Rosalie R | $113,600 |
Source: Public Records
Tax History
| Year | Tax Paid | Tax Assessment Tax Assessment Total Assessment is a certain percentage of the fair market value that is determined by local assessors to be the total taxable value of land and additions on the property. | Land | Improvement |
|---|---|---|---|---|
| 2026 | $1,067 | $64,289 | $36,540 | $27,749 |
| 2025 | $1,386 | $64,318 | $36,715 | $27,603 |
| 2024 | $1,349 | $61,945 | $34,755 | $27,190 |
| 2023 | $1,349 | $60,115 | $34,930 | $25,185 |
| 2022 | $1,308 | $48,946 | $28,455 | $20,491 |
| 2021 | $1,271 | $39,637 | $19,635 | $20,002 |
| 2020 | $1,233 | $37,477 | $17,850 | $19,627 |
| 2019 | $1,197 | $38,542 | $18,725 | $19,817 |
| 2018 | $1,164 | $33,536 | $13,545 | $19,991 |
| 2017 | $1,130 | $32,763 | $12,075 | $20,688 |
| 2016 | $1,099 | $33,274 | $11,550 | $21,724 |
| 2015 | $1,097 | $32,097 | $9,415 | $22,682 |
| 2014 | $1,057 | $30,078 | $7,980 | $22,098 |
| 2013 | -- | $28,267 | $5,985 | $22,282 |
Source: Public Records
Map
Nearby Homes
- 119 Devere Way
- 3222 Bunker Hill Ln
- 2520 Nelson Way
- 2475 Stine Way
- 3214 Valley Forge Way
- 155 York Way
- 5530 High Rock Way
- 2557 Janelle Dr
- 5520 High Rock Way
- 28 Arndell Way
- 343 Richards Way
- 3104 Sandy St
- 491 E Emerson Way
- 1125 Dodson Way
- 1940 4th St Unit 20
- 1940 4th St Unit 51
- 1940 4th St Unit 46
- 1945 4th St Unit 47
- 1945 4th St Unit 9
- 1945 4th St Unit 22
Your Personal Tour Guide
Ask me questions while you tour the home.