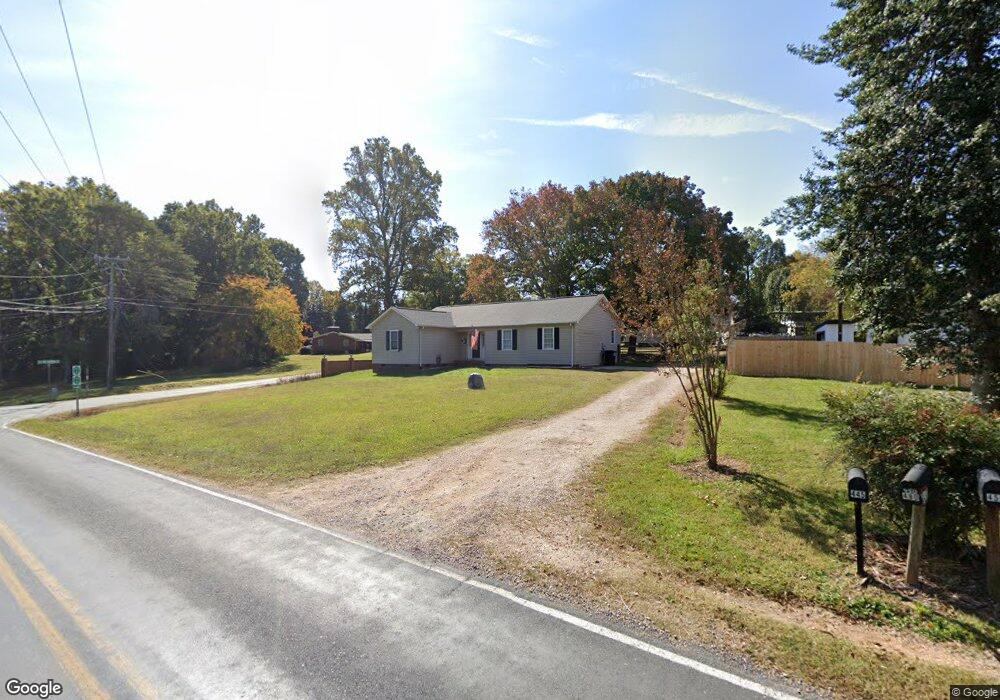
445 Stone Rd Unit 16 Salisbury, NC 28146
Estimated Value: $237,000 - $261,692
--
Bed
2
Baths
1,378
Sq Ft
$181/Sq Ft
Est. Value
About This Home
This home is located at 445 Stone Rd Unit 16, Salisbury, NC 28146 and is currently estimated at $249,423, approximately $181 per square foot. 445 Stone Rd Unit 16 is a home located in Rowan County with nearby schools including Rockwell Elementary School, Charles C Erwin Middle School, and East Rowan High School.
Ownership History
Date
Name
Owned For
Owner Type
Purchase Details
Closed on
May 8, 2024
Sold by
Hatley Lucas H and Hatley Lauren
Bought by
Pritchard Stephanie Redmond
Current Estimated Value
Purchase Details
Closed on
Feb 3, 2016
Sold by
Barber Laura L
Bought by
Hatley Lucas H
Home Financials for this Owner
Home Financials are based on the most recent Mortgage that was taken out on this home.
Original Mortgage
$100,122
Interest Rate
3.5%
Mortgage Type
FHA
Purchase Details
Closed on
Mar 25, 2015
Sold by
Barber Chris
Bought by
Barber Laura
Purchase Details
Closed on
Mar 28, 2006
Sold by
Solomon David Wayne and Solomon Tina Starnes
Bought by
Barber Christopher Ernest and Barber Laura Louise Mills
Home Financials for this Owner
Home Financials are based on the most recent Mortgage that was taken out on this home.
Original Mortgage
$92,000
Interest Rate
6.19%
Mortgage Type
Fannie Mae Freddie Mac
Create a Home Valuation Report for This Property
The Home Valuation Report is an in-depth analysis detailing your home's value as well as a comparison with similar homes in the area
Home Values in the Area
Average Home Value in this Area
Purchase History
| Date | Buyer | Sale Price | Title Company |
|---|---|---|---|
| Pritchard Stephanie Redmond | $240,000 | None Listed On Document | |
| Pritchard Stephanie Redmond | $240,000 | None Listed On Document | |
| Hatley Lucas H | $102,000 | None Available | |
| Barber Laura | -- | None Available | |
| Barber Christopher Ernest | $92,000 | None Available |
Source: Public Records
Mortgage History
| Date | Status | Borrower | Loan Amount |
|---|---|---|---|
| Previous Owner | Hatley Lucas H | $100,122 | |
| Previous Owner | Barber Christopher Ernest | $92,000 |
Source: Public Records
Tax History Compared to Growth
Tax History
| Year | Tax Paid | Tax Assessment Tax Assessment Total Assessment is a certain percentage of the fair market value that is determined by local assessors to be the total taxable value of land and additions on the property. | Land | Improvement |
|---|---|---|---|---|
| 2025 | $1,150 | $171,591 | $30,000 | $141,591 |
| 2024 | $1,150 | $171,591 | $30,000 | $141,591 |
| 2023 | $1,150 | $171,591 | $30,000 | $141,591 |
| 2022 | $862 | $115,343 | $22,000 | $93,343 |
| 2021 | $862 | $115,343 | $22,000 | $93,343 |
| 2020 | $862 | $115,343 | $22,000 | $93,343 |
| 2019 | $862 | $115,343 | $22,000 | $93,343 |
| 2018 | $699 | $94,372 | $22,000 | $72,372 |
| 2017 | $699 | $94,372 | $22,000 | $72,372 |
| 2016 | $699 | $94,372 | $22,000 | $72,372 |
| 2015 | $710 | $94,372 | $22,000 | $72,372 |
| 2014 | $681 | $94,602 | $22,000 | $72,602 |
Source: Public Records
Map
Nearby Homes
- 175 Birchwood Dr Unit 7
- 165 Birchwood Dr Unit 17
- 7660 Pop Basinger Rd
- 145 Willow Dr
- 660 Sides Rd
- 130 Delinda Dr
- 1106 Birch St
- 0000 Celestial Dr
- 1044 Oak Grove Ln Unit Lot 2
- 190 Teague Rd
- 1113 Gillan Dr
- 1160 Long Creek Ln
- 345 Rainey Rd
- 0 Cornelius Rd
- 230 Ridgeline Dr Unit 15
- Lot 6-7 Ridgeline Dr
- 133 Pecan Ln
- 3008 Gantt St
- 121 Coley Rd
- 0 Ridgeline Dr Unit 1 CAR4296284
- 445 Stone Rd
- 455 Stone Rd
- 110 Birchwood Dr
- 120 Birchwood Dr
- 450 Stone Rd
- 130 Birchwood Dr
- 480 Stone Rd
- 430 Stone Rd
- 7135 Pop Basinger Rd
- 485 Stone Rd
- 140 Birchwood Dr
- 115 Birchwood Dr
- 125 Birchwood Dr
- 135 Birchwood Dr
- 129 Birchwood Dr
- 145 Birchwood Dr
- 7155 Pop Basinger Rd
- 155 Birchwood Dr
- 7275 Pop Basinger Rd
- 160 Birchwood Dr