Estimated Value: $451,000 - $494,000
3
Beds
2
Baths
1,737
Sq Ft
$269/Sq Ft
Est. Value
About This Home
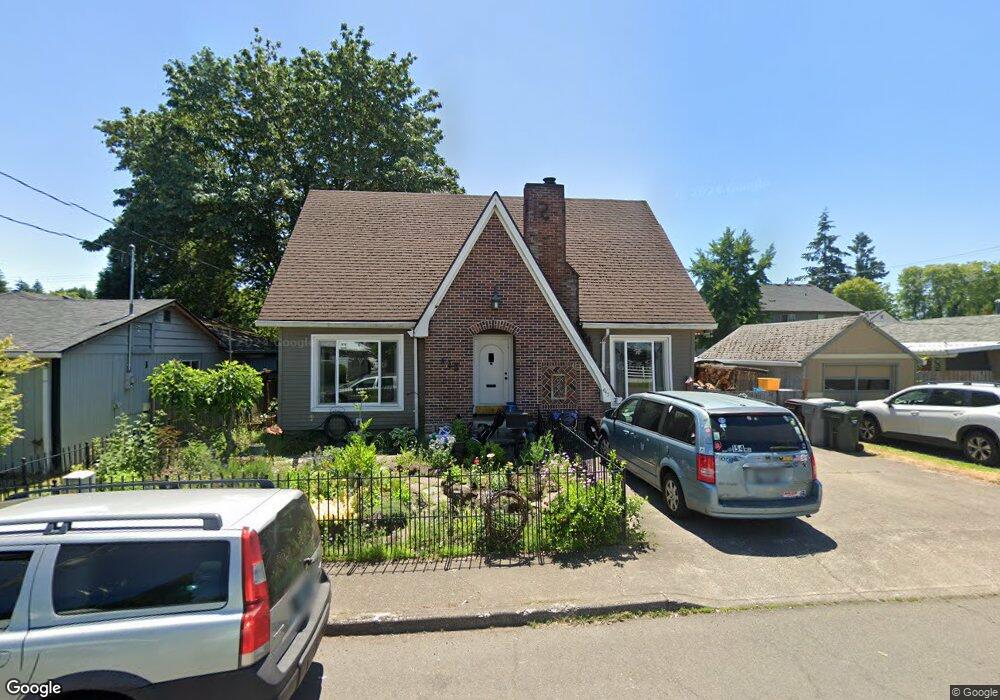
This home is located at 445 SW 2nd Ave, Canby, OR 97013 and is currently estimated at $467,828, approximately $269 per square foot. 445 SW 2nd Ave is a home located in Clackamas County with nearby schools including Josefa L. Sambrano Elementary School, Philander Lee Elementary School, and Baker Prairie Middle School.
Ownership History
Date
Name
Owned For
Owner Type
Purchase Details
Closed on
Jan 9, 2004
Sold by
Smogor Andrew J and Smogor Nancy E
Bought by
Macwilliams Robert B and Macwilliams Jennifer A
Current Estimated Value
Home Financials for this Owner
Home Financials are based on the most recent Mortgage that was taken out on this home.
Original Mortgage
$142,400
Outstanding Balance
$61,303
Interest Rate
4.87%
Mortgage Type
Purchase Money Mortgage
Estimated Equity
$406,525
Purchase Details
Closed on
Aug 21, 2000
Sold by
Elliott Jacqueline M and Beining Steven G
Bought by
Smogor Andrew J and Smogor Nancy E
Home Financials for this Owner
Home Financials are based on the most recent Mortgage that was taken out on this home.
Original Mortgage
$139,800
Interest Rate
8.15%
Purchase Details
Closed on
Nov 20, 1997
Sold by
Ronfeld Dale R and Hammond Amy K
Bought by
Beining Steven G and Elliott Jacqueline M
Home Financials for this Owner
Home Financials are based on the most recent Mortgage that was taken out on this home.
Original Mortgage
$142,500
Interest Rate
7.23%
Create a Home Valuation Report for This Property
The Home Valuation Report is an in-depth analysis detailing your home's value as well as a comparison with similar homes in the area
Home Values in the Area
Average Home Value in this Area
Purchase History
| Date | Buyer | Sale Price | Title Company |
|---|---|---|---|
| Macwilliams Robert B | $178,000 | Fidelity National Title Co | |
| Smogor Andrew J | $164,500 | Pacific Nw Title | |
| Beining Steven G | $150,000 | Stewart Title |
Source: Public Records
Mortgage History
| Date | Status | Borrower | Loan Amount |
|---|---|---|---|
| Open | Macwilliams Robert B | $142,400 | |
| Previous Owner | Smogor Andrew J | $139,800 | |
| Previous Owner | Beining Steven G | $142,500 | |
| Closed | Macwilliams Robert B | $35,600 |
Source: Public Records
Tax History Compared to Growth
Tax History
| Year | Tax Paid | Tax Assessment Tax Assessment Total Assessment is a certain percentage of the fair market value that is determined by local assessors to be the total taxable value of land and additions on the property. | Land | Improvement |
|---|---|---|---|---|
| 2025 | $3,266 | $184,365 | -- | -- |
| 2024 | $3,175 | $178,996 | -- | -- |
| 2023 | $3,175 | $173,783 | $0 | $0 |
| 2022 | $2,920 | $168,722 | $0 | $0 |
| 2021 | $2,812 | $163,808 | $0 | $0 |
| 2020 | $2,762 | $159,037 | $0 | $0 |
| 2019 | $2,630 | $154,405 | $0 | $0 |
| 2018 | $2,571 | $149,908 | $0 | $0 |
| 2017 | $2,506 | $145,542 | $0 | $0 |
| 2016 | $2,422 | $141,303 | $0 | $0 |
| 2015 | $2,339 | $137,187 | $0 | $0 |
| 2014 | $2,272 | $133,191 | $0 | $0 |
Source: Public Records
Map
Nearby Homes
- 431 SW 3rd Ave
- 299 SW 3rd Ave
- 481 S Holly St
- 1198 SW 1st Ave
- 589 NW 3rd Ave
- 574 S Ivy St
- 812 NW 3rd Ave
- 248 SE Township Rd
- 850 NW 3rd Ave
- 916 NW 2nd Ave
- 442 NW 4th Ave
- 486 S Knott St
- 385 SE Township Rd
- 1491 S Fir St Unit 18
- 1487 S Fir St Unit Lot17
- 1485 S Fir St Unit Lot 16
- 580 N Grant St
- 1339 S Baywood Ct
- 363 SE 7th Ave
- 1400 S Elm St Unit 91
- 473 SW 2nd Ave
- 429 SW 2nd Ave
- 0 3rd Ave Tax Lot 4600 Unit 10090578
- 440 SW 3rd Ave
- 430 SW 3rd Ave
- 450 SW 3rd Ave
- 419 SW 2nd Ave
- 462 SW 3rd Ave
- 460 SW 3rd Ave
- 432 SW 3rd Ave
- 210 S Elm St
- 470 SW 3rd Ave
- 480 SW 3rd Ave
- 468 SW 2nd Ave
- 416 SW 3rd Ave
- 405 SW 2nd Ave
- 194 S Elm St
- 414 SW 2nd Ave
- 494 SW 3rd Ave
- 402 SW 2nd Ave