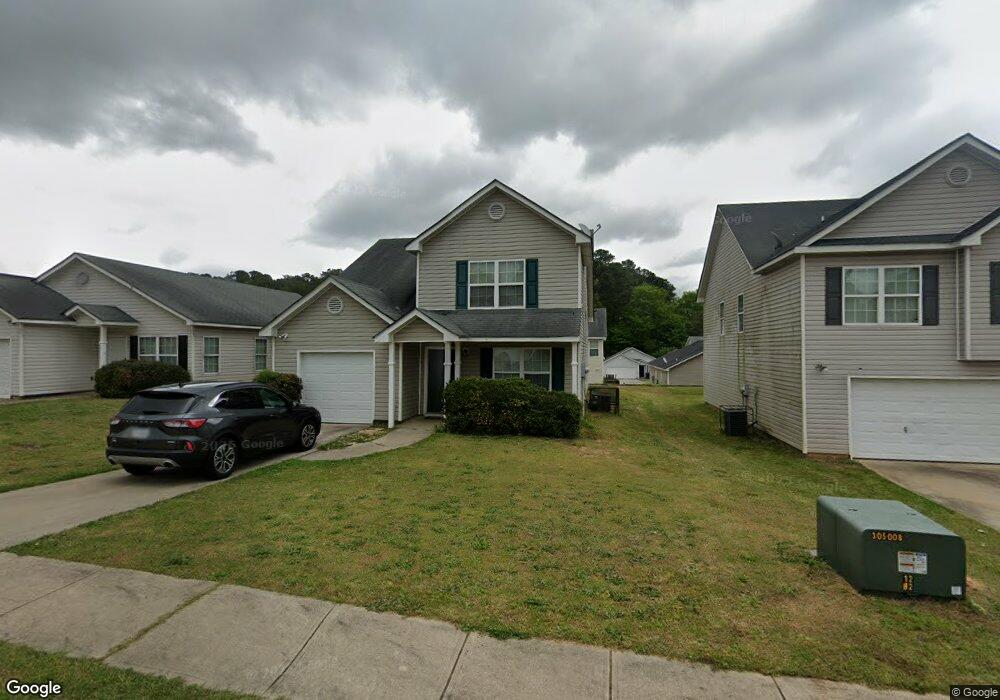
445 Victoria Blvd Oxford, GA 30054
Estimated Value: $232,000 - $290,000
--
Bed
2
Baths
1,800
Sq Ft
$145/Sq Ft
Est. Value
About This Home
This home is located at 445 Victoria Blvd, Oxford, GA 30054 and is currently estimated at $261,710, approximately $145 per square foot. 445 Victoria Blvd is a home located in Newton County with nearby schools including Flint Hill Elementary School, Cousins Middle School, and Newton High School.
Ownership History
Date
Name
Owned For
Owner Type
Purchase Details
Closed on
Jun 15, 2016
Sold by
Mnsf Ii Acquisitions Llc
Bought by
Mnsf Ii W1 Llc
Current Estimated Value
Purchase Details
Closed on
Jun 5, 2015
Sold by
Atlanta Property Acquistion I Llc
Bought by
Mnsf Ii Acquistions Llc
Purchase Details
Closed on
Feb 6, 2009
Sold by
Jpmorgan Chase Bank Na
Bought by
Atlanta Prop Acquisition I Llc
Purchase Details
Closed on
Oct 7, 2008
Sold by
Johnson Jimmy
Bought by
Jpmorgan Chase Bank Na
Purchase Details
Closed on
Aug 4, 2005
Sold by
1St Quality Bldrs Llc
Bought by
Johnson Jimmy
Home Financials for this Owner
Home Financials are based on the most recent Mortgage that was taken out on this home.
Original Mortgage
$99,316
Interest Rate
7.88%
Mortgage Type
New Conventional
Create a Home Valuation Report for This Property
The Home Valuation Report is an in-depth analysis detailing your home's value as well as a comparison with similar homes in the area
Home Values in the Area
Average Home Value in this Area
Purchase History
| Date | Buyer | Sale Price | Title Company |
|---|---|---|---|
| Mnsf Ii W1 Llc | -- | -- | |
| Mnsf Ii Acquistions Llc | $78,000 | -- | |
| Atlanta Prop Acquisition I Llc | $47,100 | -- | |
| Jpmorgan Chase Bank Na | $105,159 | -- | |
| Johnson Jimmy | $124,200 | -- |
Source: Public Records
Mortgage History
| Date | Status | Borrower | Loan Amount |
|---|---|---|---|
| Previous Owner | Johnson Jimmy | $99,316 |
Source: Public Records
Tax History Compared to Growth
Tax History
| Year | Tax Paid | Tax Assessment Tax Assessment Total Assessment is a certain percentage of the fair market value that is determined by local assessors to be the total taxable value of land and additions on the property. | Land | Improvement |
|---|---|---|---|---|
| 2025 | $2,768 | $109,480 | $14,000 | $95,480 |
| 2024 | $2,638 | $102,440 | $14,000 | $88,440 |
| 2023 | $2,598 | $94,160 | $6,000 | $88,160 |
| 2022 | $2,329 | $84,240 | $6,000 | $78,240 |
| 2021 | $1,731 | $55,640 | $6,000 | $49,640 |
| 2020 | $1,673 | $48,640 | $6,000 | $42,640 |
| 2019 | $1,519 | $43,400 | $6,000 | $37,400 |
| 2018 | $1,335 | $37,760 | $4,800 | $32,960 |
| 2017 | $1,194 | $33,640 | $4,800 | $28,840 |
| 2016 | $1,060 | $29,760 | $4,000 | $25,760 |
| 2015 | $959 | $26,800 | $4,000 | $22,800 |
| 2014 | -- | $21,520 | $0 | $0 |
Source: Public Records
Map
Nearby Homes
- 80 Victoria Blvd
- 20 ACRES Oxford Rd
- 36 ACRES Oxford Rd
- 70 Oxford Rd
- 142 Longstreet Cir
- 122 Longstreet Cir
- 0 W Richardson St Unit 10643275
- 497 Cook Rd
- 9226 Carlton Trail NW
- 405 W Richardson St
- 1206 Wesley St
- 318 W Bonnell St
- 0 Asbury St Unit 10646779
- 1417 Wesley St
- 908 Emory St
- 1008 Emory St
- 1310 Emory St
- 9177 Woodhaven Dr NW
- 9168 Woodhaven Dr NW
- 250 Stagecoach Rd
- 445 Victoria Blvd
- 445 Victoria Blvd
- 435 Victoria Blvd
- 455 Victoria Blvd
- 45 Victoria Blvd
- 45 Victoria Blvd
- 425 Victoria Blvd
- 465 Victoria Blvd
- 35 Victoria Blvd
- 55 Victoria Blvd
- 10 Cody Cir
- 65 Victoria Blvd
- 415 Victoria Blvd Unit 74
- 415 Victoria Blvd
- 475 Victoria Blvd
- 25 Victoria Blvd
- 25 Victoria Blvd Unit Lot 87
- 490 Victoria Blvd
- 75 Victoria Blvd
- 20 Cody Cir