
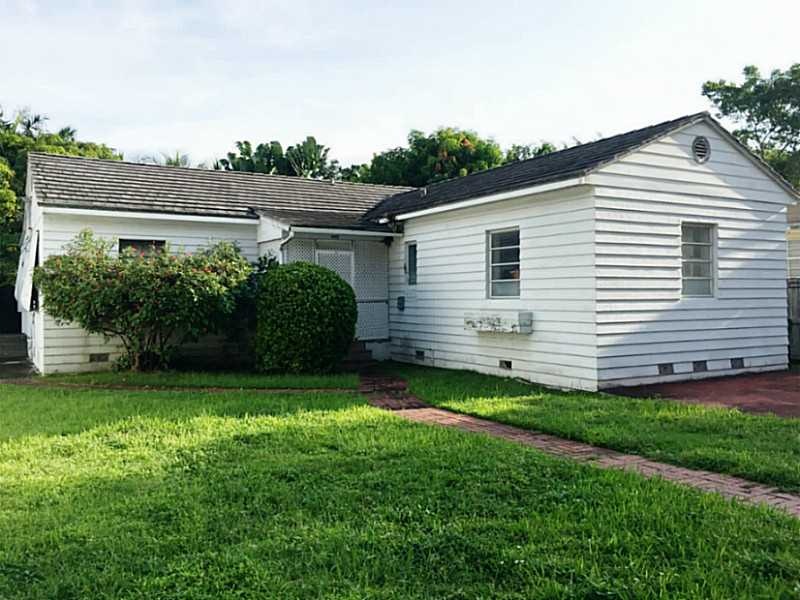
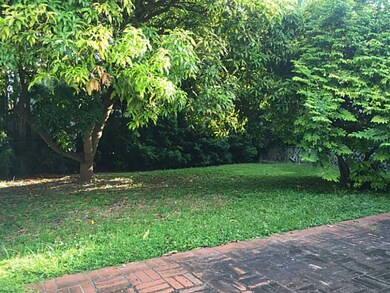
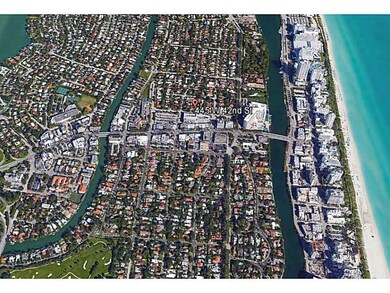
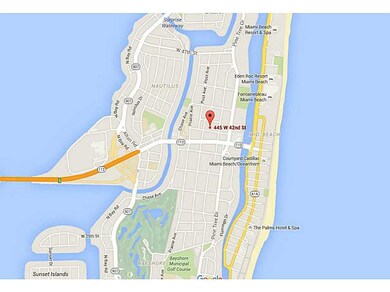
445 W 42nd St Miami Beach, FL 33140
Nautilus Neighborhood
3
Beds
2
Baths
1,904
Sq Ft
6,900
Sq Ft Lot
Highlights
- No HOA
- 1-Story Property
- South Facing Home
- North Beach Elementary School Rated A-
- Central Heating and Cooling System
About This Home
As of April 2023Officially "THE BEST PRICED HOME IN MID MIAMI BEACH". Every offer will be considered. Opportune moment gives you a desirable location to build your dream home or renovate to perfection. Conveniently stationed on a one-way street between Royal Palm Avenue & Sheridan Avenue, just a block from 41st Street. Close proximity to hospitals, parks, A+ schools & houses of worship. Enjoy short walks to great restaurants & sandy beaches.
Last Agent to Sell the Property
Coldwell Banker Realty License #3140658 Listed on: 09/30/2015
Home Details
Home Type
- Single Family
Est. Annual Taxes
- $3,516
Year Built
- Built in 1948
Lot Details
- 6,900 Sq Ft Lot
- South Facing Home
- Property is zoned 10/S FM
Home Design
- Concrete Block And Stucco Construction
Interior Spaces
- 1,904 Sq Ft Home
- 1-Story Property
Bedrooms and Bathrooms
- 3 Bedrooms
- 2 Full Bathrooms
Parking
- Driveway
- Open Parking
Utilities
- Central Heating and Cooling System
Community Details
- No Home Owners Association
- Orchard Sub No 4 Subdivision
Listing and Financial Details
- Assessor Parcel Number 02-32-22-001-0690
Ownership History
Date
Name
Owned For
Owner Type
Purchase Details
Listed on
Jul 15, 2021
Closed on
Apr 17, 2023
Sold by
Isaacoff Joseph
Bought by
Bais Medrash Of Miami Beach Inc
Seller's Agent
Menachem Fellig
Compass Florida, LLC.
Buyer's Agent
Menachem Fellig
Compass Florida, LLC.
List Price
$2,999,999
Sold Price
$2,875,000
Premium/Discount to List
-$124,999
-4.17%
Views
65
Current Estimated Value
Home Financials for this Owner
Home Financials are based on the most recent Mortgage that was taken out on this home.
Estimated Appreciation
$235,530
Avg. Annual Appreciation
3.16%
Purchase Details
Closed on
May 25, 2021
Sold by
Bgm Golden Gruop Llc
Bought by
Isaacoff Joseph
Home Financials for this Owner
Home Financials are based on the most recent Mortgage that was taken out on this home.
Original Mortgage
$1,500,000
Interest Rate
2.9%
Mortgage Type
New Conventional
Purchase Details
Listed on
Sep 30, 2015
Closed on
Jun 9, 2016
Sold by
Riverside District Development Llc
Bought by
Bgm Golden Group Llc
Seller's Agent
Hirokazu Sumida
Coldwell Banker Realty
Buyer's Agent
Hirokazu Sumida
Coldwell Banker Realty
List Price
$950,000
Sold Price
$475,000
Premium/Discount to List
-$475,000
-50%
Home Financials for this Owner
Home Financials are based on the most recent Mortgage that was taken out on this home.
Avg. Annual Appreciation
22.35%
Purchase Details
Listed on
Sep 30, 2015
Closed on
Apr 27, 2016
Sold by
Moreno Katina
Bought by
Riverside District Development Llc
Seller's Agent
Hirokazu Sumida
Coldwell Banker Realty
Buyer's Agent
Hirokazu Sumida
Coldwell Banker Realty
List Price
$950,000
Sold Price
$475,000
Premium/Discount to List
-$475,000
-50%
Purchase Details
Closed on
Mar 7, 2014
Sold by
Bodnar Catherine
Bought by
Moreno Katina
Similar Homes in Miami Beach, FL
Create a Home Valuation Report for This Property
The Home Valuation Report is an in-depth analysis detailing your home's value as well as a comparison with similar homes in the area
Home Values in the Area
Average Home Value in this Area
Purchase History
| Date | Type | Sale Price | Title Company |
|---|---|---|---|
| Warranty Deed | $2,875,000 | Madison Title | |
| Warranty Deed | $2,440,000 | Straight Line Title | |
| Warranty Deed | $613,000 | Attorney | |
| Warranty Deed | $475,000 | Attorney | |
| Warranty Deed | -- | Attorney |
Source: Public Records
Mortgage History
| Date | Status | Loan Amount | Loan Type |
|---|---|---|---|
| Previous Owner | $1,500,000 | New Conventional |
Source: Public Records
Property History
| Date | Event | Price | Change | Sq Ft Price |
|---|---|---|---|---|
| 04/18/2023 04/18/23 | Sold | $2,875,000 | -4.2% | $992 / Sq Ft |
| 03/02/2023 03/02/23 | Pending | -- | -- | -- |
| 10/03/2022 10/03/22 | For Sale | $2,999,999 | 0.0% | $1,035 / Sq Ft |
| 09/16/2022 09/16/22 | Pending | -- | -- | -- |
| 08/29/2022 08/29/22 | Price Changed | $2,999,999 | -9.1% | $1,035 / Sq Ft |
| 07/27/2022 07/27/22 | Price Changed | $3,300,000 | 0.0% | $1,138 / Sq Ft |
| 07/27/2022 07/27/22 | For Sale | $3,300,000 | +14.8% | $1,138 / Sq Ft |
| 07/25/2022 07/25/22 | Off Market | $2,875,000 | -- | -- |
| 07/01/2022 07/01/22 | For Sale | $3,350,000 | +16.5% | $1,156 / Sq Ft |
| 06/30/2022 06/30/22 | Off Market | $2,875,000 | -- | -- |
| 06/01/2022 06/01/22 | Off Market | $3,800,000 | -- | -- |
| 08/20/2021 08/20/21 | Price Changed | $2,800,000 | -6.7% | $966 / Sq Ft |
| 07/14/2021 07/14/21 | For Sale | $3,000,000 | +23.0% | $1,035 / Sq Ft |
| 03/19/2021 03/19/21 | Sold | $2,440,000 | -12.8% | $803 / Sq Ft |
| 12/11/2020 12/11/20 | Price Changed | $2,799,000 | -3.5% | $921 / Sq Ft |
| 09/10/2020 09/10/20 | For Sale | $2,900,000 | +510.5% | $954 / Sq Ft |
| 04/27/2016 04/27/16 | Sold | $475,000 | -31.7% | $249 / Sq Ft |
| 03/18/2016 03/18/16 | Pending | -- | -- | -- |
| 02/12/2016 02/12/16 | Price Changed | $695,000 | -4.1% | $365 / Sq Ft |
| 01/13/2016 01/13/16 | Price Changed | $725,000 | -6.5% | $381 / Sq Ft |
| 12/01/2015 12/01/15 | Price Changed | $775,000 | -8.7% | $407 / Sq Ft |
| 10/27/2015 10/27/15 | Price Changed | $849,000 | -10.6% | $446 / Sq Ft |
| 09/30/2015 09/30/15 | For Sale | $950,000 | -- | $499 / Sq Ft |
Source: MIAMI REALTORS® MLS
Tax History Compared to Growth
Tax History
| Year | Tax Paid | Tax Assessment Tax Assessment Total Assessment is a certain percentage of the fair market value that is determined by local assessors to be the total taxable value of land and additions on the property. | Land | Improvement |
|---|---|---|---|---|
| 2025 | $43,210 | $2,357,022 | $1,114,350 | $1,242,672 |
| 2024 | $41,262 | $2,299,451 | $1,043,834 | $1,255,617 |
| 2023 | $41,262 | $2,112,775 | $0 | $0 |
| 2022 | $36,089 | $1,920,705 | $639,261 | $1,281,444 |
| 2021 | $30,230 | $1,565,683 | $410,703 | $1,154,980 |
| 2020 | $8,519 | $440,039 | $440,039 | $0 |
| 2019 | $8,527 | $440,039 | $440,039 | $0 |
| 2018 | $9,378 | $498,711 | $498,711 | $0 |
| 2017 | $10,282 | $539,913 | $0 | $0 |
| 2016 | $13,086 | $673,676 | $0 | $0 |
| 2015 | $12,649 | $638,454 | $0 | $0 |
| 2014 | $3,516 | $213,257 | $0 | $0 |
Source: Public Records
Agents Affiliated with this Home
-
Seller's Agent in 2023
Menachem Fellig
Compass Florida, LLC.
(305) 632-8803
30 in this area
150 Total Sales
-
Seller's Agent in 2021
Kathrin Rein
Keller Williams Miami Beach
(305) 735-6939
2 in this area
146 Total Sales
-
Seller's Agent in 2016
Hirokazu Sumida
Coldwell Banker Realty
(786) 444-5505
1 in this area
29 Total Sales
Map
Source: MIAMI REALTORS® MLS
MLS Number: A2182064
APN: 02-3222-001-0690
Disclaimer: Certain information contained herein is derived from information provided by parties other than Homes.com. All information provided is deemed reliable, but is not guaranteed to be accurate and should be independently verified.
![]() IDX information is provided exclusively for personal, non-commercial use, and may not be used for any purpose other than to identify prospective properties consumers may be interested in purchasing. Information is deemed reliable but not guaranteed.
IDX information is provided exclusively for personal, non-commercial use, and may not be used for any purpose other than to identify prospective properties consumers may be interested in purchasing. Information is deemed reliable but not guaranteed.
Nearby Homes
- 427 W 43rd St
- 4316 Sheridan Ave
- 340 W 42 St Unit 508
- 340 W 42nd St Unit 601
- 4275 Prairie Ave
- 4421 Post Ave
- 4101 Pine Tree Dr Unit 1715
- 4101 Pine Tree Dr Unit 1812
- 4101 Pine Tree Dr Unit 621,620
- 4230 Chase Ave
- 3760 Royal Palm Ave
- 3747 Royal Palm Ave
- 3738 Pine Tree Dr
- 3722 Royal Palm Ave
- 3605 Flamingo Dr
- 4201 Indian Creek Dr Unit 9
- 4015 Indian Creek Dr Unit 106
- 4015 Indian Creek Dr Unit 204
- 4015 Indian Creek Dr Unit 104
- 4015 Indian Creek Dr Unit 303