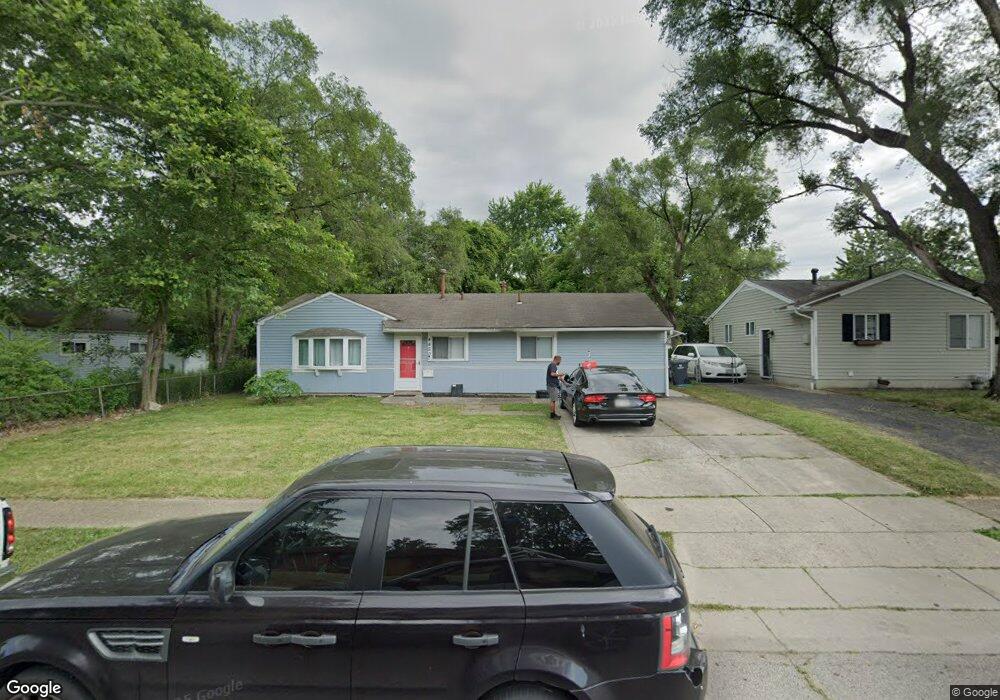
4450 Etna Rd Columbus, OH 43213
Estimated Value: $197,526 - $221,000
3
Beds
2
Baths
1,339
Sq Ft
$157/Sq Ft
Est. Value
About This Home
This home is located at 4450 Etna Rd, Columbus, OH 43213 and is currently estimated at $209,632, approximately $156 per square foot. 4450 Etna Rd is a home located in Franklin County with nearby schools including Etna Road Elementary School, Beechwood Elementary School, and Rosemore Middle School.
Ownership History
Date
Name
Owned For
Owner Type
Purchase Details
Closed on
Nov 6, 2006
Sold by
Lasalle Bank Na
Bought by
Abreha Selemon
Current Estimated Value
Home Financials for this Owner
Home Financials are based on the most recent Mortgage that was taken out on this home.
Original Mortgage
$56,525
Interest Rate
10.87%
Mortgage Type
Purchase Money Mortgage
Purchase Details
Closed on
Mar 14, 2006
Sold by
Boothe Mary S and Wells Fargo Home Mortgage Inc
Bought by
Lasalle Bank Na and Certificateholders Of Emc Mortgage Loan
Purchase Details
Closed on
Feb 21, 1997
Sold by
Ope Inc
Bought by
Boothe Sherman A and Boothe Mary S
Home Financials for this Owner
Home Financials are based on the most recent Mortgage that was taken out on this home.
Original Mortgage
$56,700
Interest Rate
9.4%
Mortgage Type
New Conventional
Purchase Details
Closed on
Jan 23, 1995
Sold by
Yinger Cynthia
Bought by
Ope Inc
Purchase Details
Closed on
Nov 1, 1984
Create a Home Valuation Report for This Property
The Home Valuation Report is an in-depth analysis detailing your home's value as well as a comparison with similar homes in the area
Home Values in the Area
Average Home Value in this Area
Purchase History
| Date | Buyer | Sale Price | Title Company |
|---|---|---|---|
| Abreha Selemon | $59,500 | None Available | |
| Lasalle Bank Na | $60,000 | None Available | |
| Boothe Sherman A | $60,000 | -- | |
| Ope Inc | $50,000 | -- | |
| -- | $43,500 | -- |
Source: Public Records
Mortgage History
| Date | Status | Borrower | Loan Amount |
|---|---|---|---|
| Previous Owner | Abreha Selemon | $56,525 | |
| Previous Owner | Boothe Sherman A | $56,700 |
Source: Public Records
Tax History Compared to Growth
Tax History
| Year | Tax Paid | Tax Assessment Tax Assessment Total Assessment is a certain percentage of the fair market value that is determined by local assessors to be the total taxable value of land and additions on the property. | Land | Improvement |
|---|---|---|---|---|
| 2024 | $2,805 | $56,910 | $14,630 | $42,280 |
| 2023 | $2,680 | $56,910 | $14,630 | $42,280 |
| 2022 | $1,725 | $26,920 | $6,440 | $20,480 |
| 2021 | $1,694 | $26,920 | $6,440 | $20,480 |
| 2020 | $1,664 | $26,920 | $6,440 | $20,480 |
| 2019 | $1,421 | $20,270 | $5,150 | $15,120 |
| 2018 | $1,412 | $20,270 | $5,150 | $15,120 |
| 2017 | $1,467 | $20,270 | $5,150 | $15,120 |
| 2016 | $1,655 | $19,610 | $5,220 | $14,390 |
| 2015 | $1,379 | $19,610 | $5,220 | $14,390 |
| 2014 | $1,329 | $19,610 | $5,220 | $14,390 |
| 2013 | $1,010 | $21,805 | $5,810 | $15,995 |
Source: Public Records
Map
Nearby Homes
- 451 Beaver Ave
- 579 Westphal Ave
- 4489 Saint Margaret Ln
- 571 S Hamilton Rd
- 4368 Broadhurst Dr
- 4653 Kae Ave
- 4148 Elbern Ave
- 4662 Jae Ave
- 353 Shell Ct E
- 4572 Saint Anthony Ln
- 469 Cumberland Dr
- 4780 Etna Rd Unit 782
- 798 S Yearling Rd
- 424 Cumberland Dr
- 4094 E Main St
- 963 Erickson Ave
- 4144 Mcallister Ave
- 1085 S Hamilton Rd
- 547 Country Club Rd
- 322 Fairway Cir
- 492 Westphal Ave
- 486 Westphal Ave
- 507 Bernhard Rd
- 495 Bernhard Rd
- 478 Westphal Ave
- 4449 Etna Rd
- 487 Bernhard Rd
- 491 Westphal Ave
- 470 Westphal Ave
- 481 Westphal Ave
- 479 Bernhard Rd
- 508 Bernhard Rd
- 522 Westphal Ave
- 4410 Etna Rd
- 4423 Kumler Dr
- 462 Westphal Ave
- 496 Bernhard Rd
- 471 Bernhard Rd
- 503 Westphal Ave
- 528 Westphal Ave