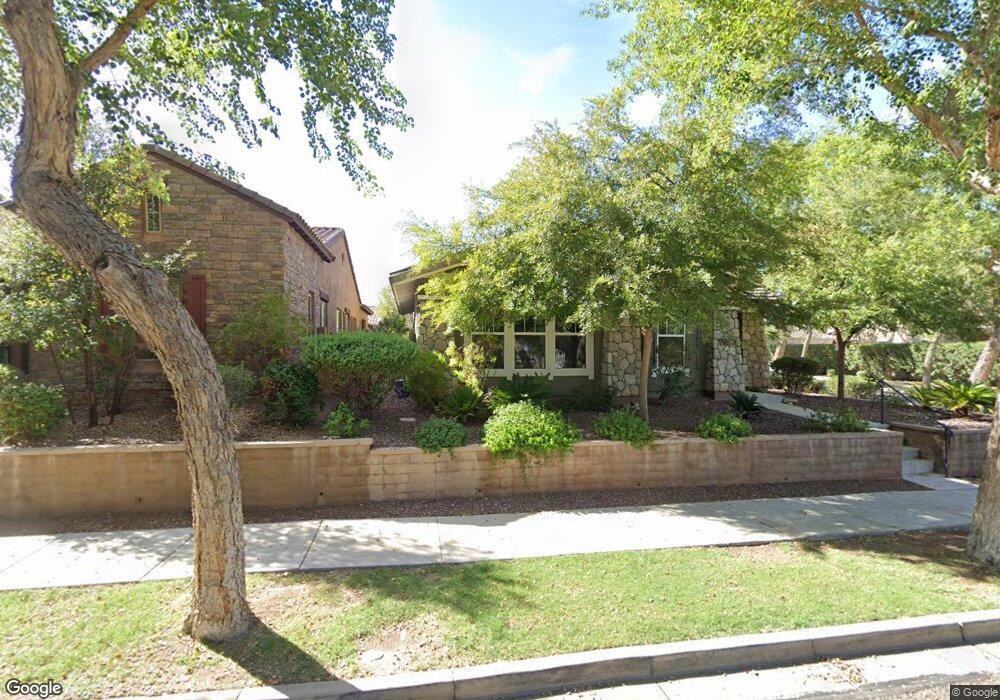
4450 N Jackson Ct Buckeye, AZ 85396
Estimated Value: $485,516 - $623,000
--
Bed
3
Baths
1,742
Sq Ft
$307/Sq Ft
Est. Value
About This Home
This home is located at 4450 N Jackson Ct, Buckeye, AZ 85396 and is currently estimated at $534,629, approximately $306 per square foot. 4450 N Jackson Ct is a home located in Maricopa County with nearby schools including Verrado Elementary School, Verrado Middle School, and Verrado High School.
Ownership History
Date
Name
Owned For
Owner Type
Purchase Details
Closed on
Feb 8, 2018
Sold by
Dethloff John R and The Dethloff Family Trust
Bought by
Cole Marqua Lynn
Current Estimated Value
Home Financials for this Owner
Home Financials are based on the most recent Mortgage that was taken out on this home.
Original Mortgage
$266,400
Outstanding Balance
$225,390
Interest Rate
3.95%
Mortgage Type
New Conventional
Estimated Equity
$309,239
Purchase Details
Closed on
Apr 24, 2015
Sold by
Dethloff John R and Dethloff Sara J
Bought by
The Dethloff Family Trust
Purchase Details
Closed on
Dec 13, 2007
Sold by
Ashton Woods Arizona Llc
Bought by
Dethloff John R and Dethloff Sara J
Home Financials for this Owner
Home Financials are based on the most recent Mortgage that was taken out on this home.
Original Mortgage
$323,444
Interest Rate
6.2%
Mortgage Type
New Conventional
Create a Home Valuation Report for This Property
The Home Valuation Report is an in-depth analysis detailing your home's value as well as a comparison with similar homes in the area
Home Values in the Area
Average Home Value in this Area
Purchase History
| Date | Buyer | Sale Price | Title Company |
|---|---|---|---|
| Cole Marqua Lynn | $302,250 | Dhi Title Agency | |
| The Dethloff Family Trust | -- | None Available | |
| Dethloff John R | $332,612 | First American Title Ins Co |
Source: Public Records
Mortgage History
| Date | Status | Borrower | Loan Amount |
|---|---|---|---|
| Open | Cole Marqua Lynn | $266,400 | |
| Previous Owner | Dethloff John R | $323,444 |
Source: Public Records
Tax History Compared to Growth
Tax History
| Year | Tax Paid | Tax Assessment Tax Assessment Total Assessment is a certain percentage of the fair market value that is determined by local assessors to be the total taxable value of land and additions on the property. | Land | Improvement |
|---|---|---|---|---|
| 2025 | $3,075 | $24,646 | -- | -- |
| 2024 | $3,044 | $23,472 | -- | -- |
| 2023 | $3,044 | $34,270 | $6,850 | $27,420 |
| 2022 | $2,889 | $28,360 | $5,670 | $22,690 |
| 2021 | $3,067 | $27,370 | $5,470 | $21,900 |
| 2020 | $2,893 | $25,610 | $5,120 | $20,490 |
| 2019 | $2,952 | $23,860 | $4,770 | $19,090 |
| 2018 | $2,717 | $22,230 | $4,440 | $17,790 |
| 2017 | $2,687 | $20,180 | $4,030 | $16,150 |
| 2016 | $2,546 | $20,030 | $4,000 | $16,030 |
| 2015 | $2,412 | $18,510 | $3,700 | $14,810 |
Source: Public Records
Map
Nearby Homes
- 4390 N Jackson Ct
- 21071 W Elm Way Ct
- 4565 N Point Ridge Rd
- 21111 W Glen St
- 21064 W Sage Hill Rd
- 21109 W Sunrise Ln
- 21134 W Sunrise Ln
- 21153 W Glen St
- 21173 W Elm Way
- 20945 W Hillcrest Blvd
- 4571 N Arbor Way
- 20946 W Prospector Way
- 21166 W Main St
- 21127 W Minnezona Ave
- 5656 N 205th Ln
- 5664 N 205th Ln
- 5678 N 205th Ln
- 21143 W Minnezona Ave
- 20760 W Minnezona Ave
- 21019 W Court St
- 4442 N Jackson Ct
- 4434 N Jackson Ct
- 20966 W Glen St
- 4449 N Village St
- 4426 N Jackson Ct
- 4441 N Village St
- 4433 N Village St
- 21003 W Cora Vista
- 4418 N Jackson Ct
- 4425 N Village St
- 20958 W Glen St
- 4417 N Village St
- 20993 W Cora Vista
- 20993 W Cora Vista
- 4406 N Jackson Ct
- 21017 W Glen St
- 4453 N Jackson Ct
- 4445 N Jackson Ct
- 20983 W Cora Vista
- 4405 N Village St